 Leanpub
In this tutorial, we will use Normal Mode Wizard (NMWiz), a VMD plugin that serves as a GUI for ProDy, to perform ANM analysis on the SARS-CoV-2 RBD. We will visualize the results in a cross-correlation map and square fluctuation plot and then produce ANM animations showing the predicted range of motion of the SARS-CoV-2 spike RBD.
Before starting, make sure that you have installed VMD and know how to load molecules into the program. If you need a refresher, visit the Multiseq tutorial.
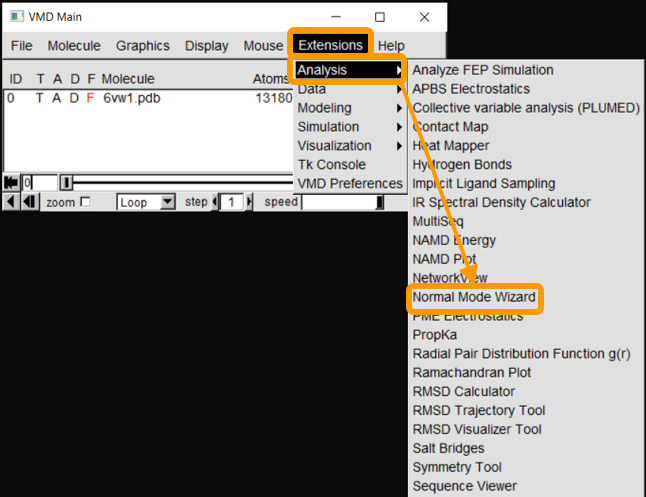
First, load the SARS-CoV-2 spike protein/ACE2 enzyme complex (6vw1) into VMD. Then, start up NMWiz by clicking Extensions > Analysis > Normal Mode Wizard.
A small window will open. Select ProDy Interface.

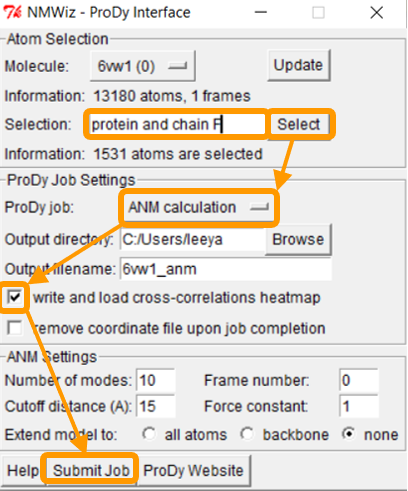
We want to focus on the RBD of SARS-CoV-2, so we need to choose a new selection. In ProDy Interface, change Selection to protein and chain F and click Select. Next, make sure that ANM calculation is selected for ProDy job:. Check the box for write and load cross-correlations heatmap. Finally, click Submit Job.
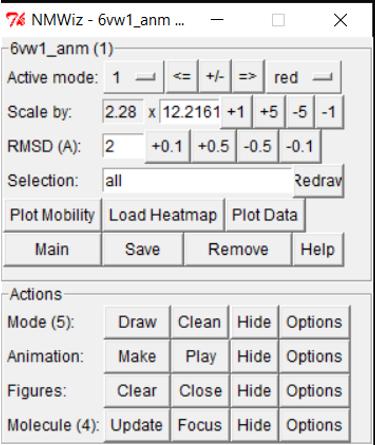
Note: Let the program run and do not click any of the VMD windows, as this may cause the program to crash or become unresponsive. The job can take between a few seconds and a few minutes. When the job is complete, you will see a new window NMWiz - 6vw1_anm ... and the cross=correlation heatmap appear.

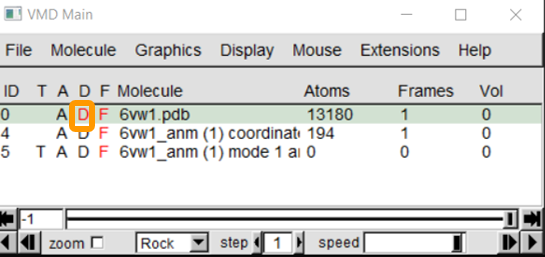
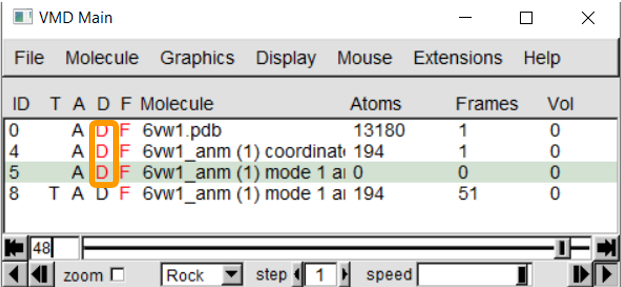
Now that the ANM calculations are completed, you will see the visualization displayed in VMD Main. Disable the original visualization of 6vw1 by double-clicking on the letter D. The letter will change red to indicate that it has been disabled.
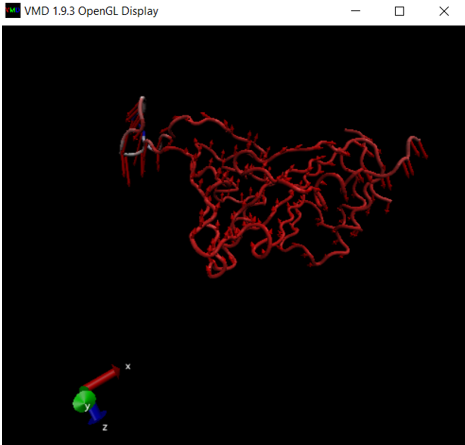
In OpenGL Display, you can see the protein with numerous arrows representing the calculated fluctuations.
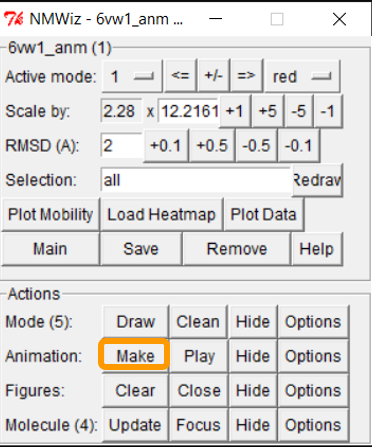
To visualize the protein movements as described by the arrows, we need to create the animation. Return to the NMWiz - 6vw1_anm... window and click Make next to Animations.
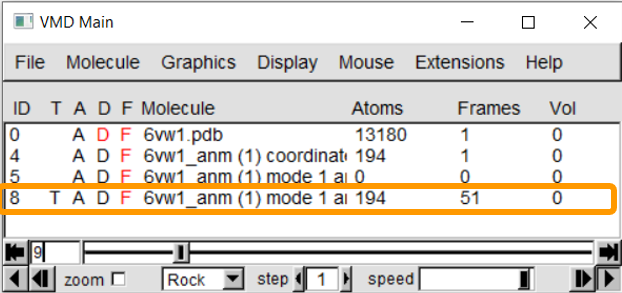
VMD Main should now show a new row for the animation.
The animation should also be visible in OpenGL Display. However, the previous visualizations are somewhat in the way. We can disable them in the same way as before by double-clicking the letter D.
You should now be able to see the animation of the ANM fluctuations of 6vw1, as shown in the figure below.
We now will return to the main text and interpret our results.
