 Leanpub
Comparing structures with Qres
Recall the following two toy protein structures from the part 1 exercises.
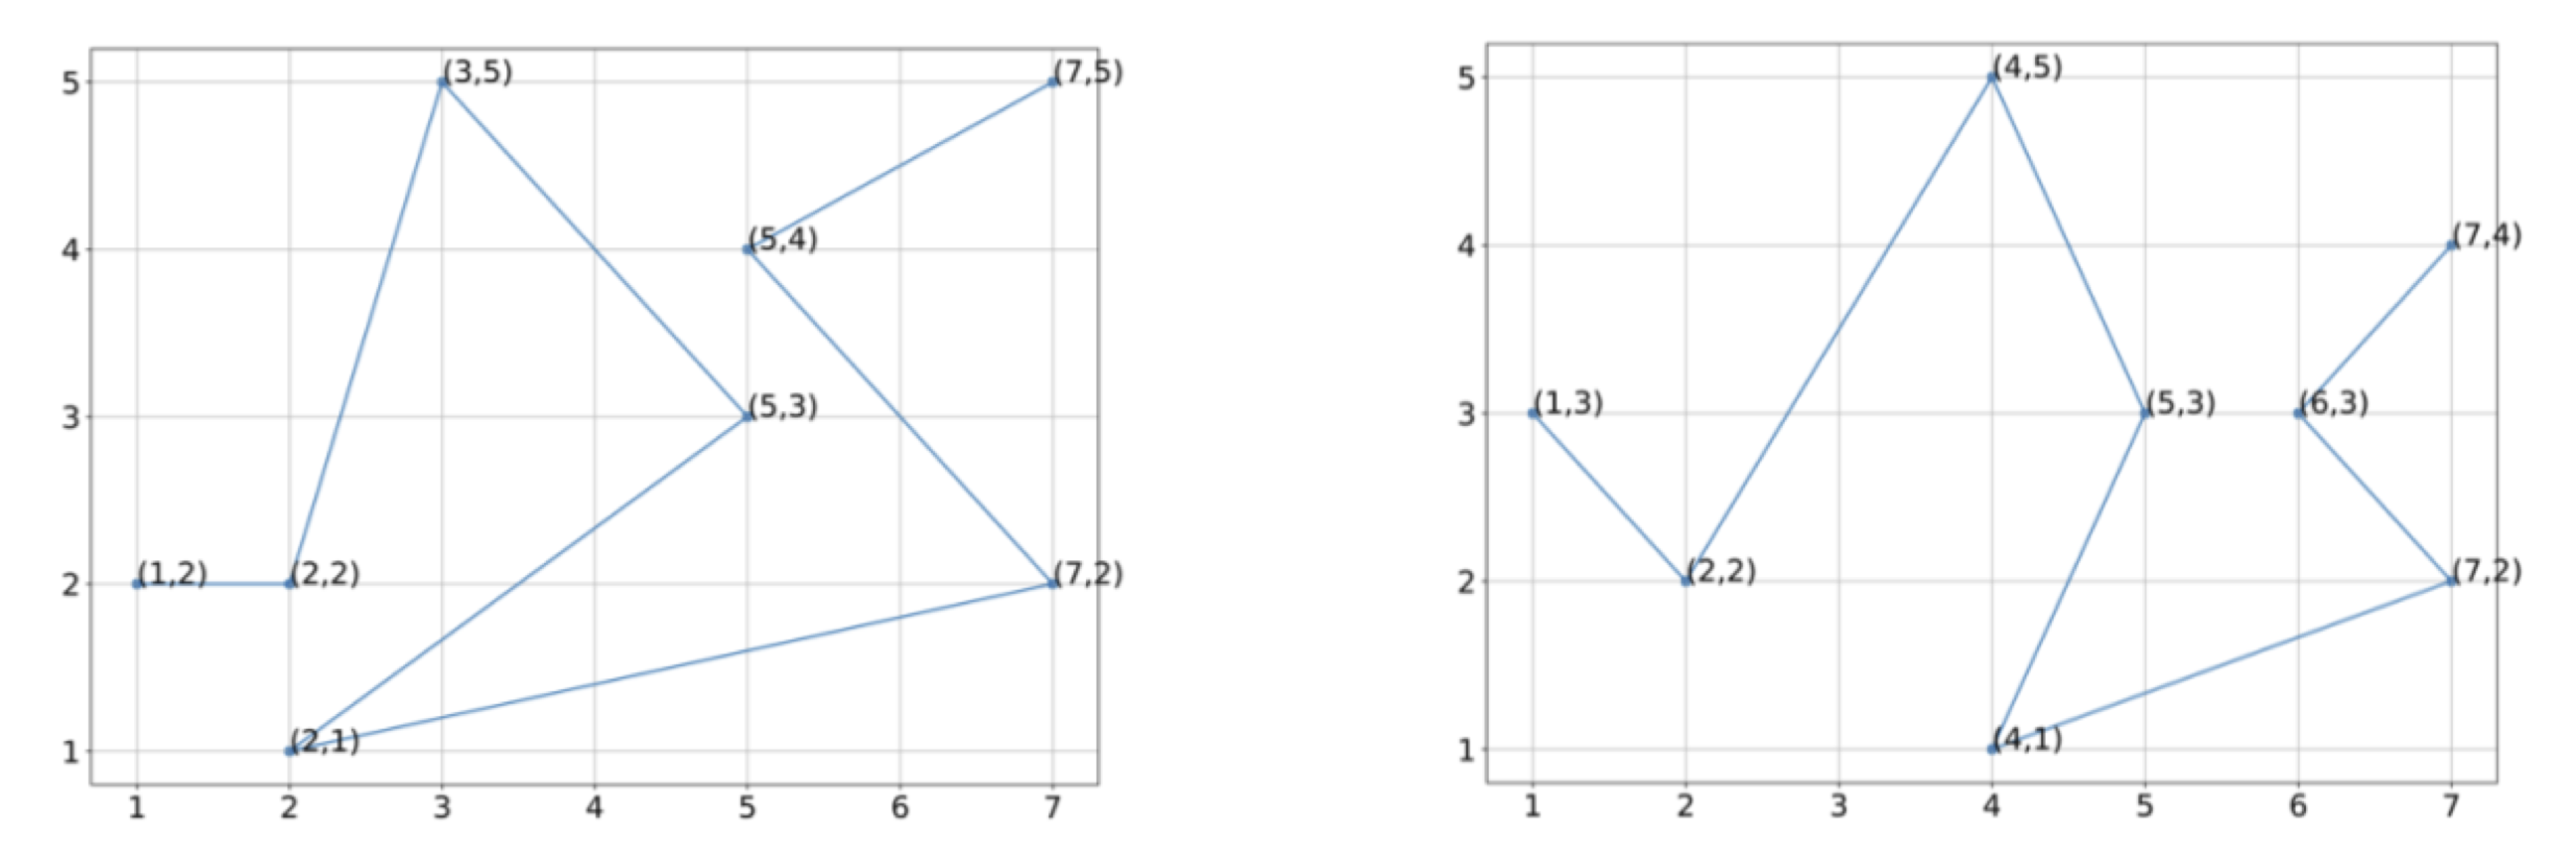 Two hypothetical protein structures with vectorizations into eight points each.
The formula for Qres of the i-th sampled point in a protein with N amino acids is reproduced below:
Exercise: Assuming that the first sampled point in the two figures are, respectively, (1,2) and (1,3), compute the Qres of the fourth sampled point.
In a tutorial, we computed Qres between SARS and SARS-CoV-2 RBD to find local differences between the two structures. We will repeat this analysis with hemoglobin subunit alpha. Using the PDB files of human hemoglobin (1SI4) and mako shark hemoglobin (3MKB), upload the protein structures into VMD. Align the structures using “Multiseq” and visualize the structures using Qres as the coloring parameter.
Exercise: Use the visualizations to determine where the protein structures vary the most. Do your findings make sense intuitively?
Calculating interaction energy
We will perform a short analysis of the SARS-CoV-2 spike protein’s interaction energy with the human receptor ACE2 using NAMD. Download the PDB file of the SARS-CoV-2 RBD-ACE2 complex (PDB entry: 6VW1) and download 6VW1.pdb. Upload the structure into VMD and navigate to Extension > Analysis > NAMD Energy. Calculate the energy types “VDW” and “Elec” using the following selections:
| Selection 1 | Selection 2 | |
|---|---|---|
| A | protein and chain B | protein and chain F and resid 482 to 486 |
| B | protein and chain B | protein and chain F and resid 383 to 394 |
Exercise: How do the results of part A compare with those of part B? Can you justify the results? (Hint: Visualize the specific residues).
Note: For help, visit the module tutorials for VMD visualization and NAMD Energy. For additional troubleshooting, download NamdEnergyAssignment.zip and follow README.txt.
Visualizing glycans
In the conclusion of part 2 of this module, we mentioned that the surface of viruses and host cells are “fuzzy” because they are covered by structures called glycans. We will use what we learned about VMD in a tutorial to visualize glycans on the spike protein of both viruses. First, we will need to download the protein structures of the SARS-CoV spike protein (PDB entry: 5xlr and the SARS-CoV-2 spike protein (PDB entry: 6vxx. Load each structure into VMD and navigate to Graphics > Representations. For VMD, there is no specific keyword to select glycans, and so we will use a workaround with the keywords: "not protein and not water".

Exercise: Create the representation. Assuming that all the non-proteins are glycans, which structure contains the most number of glycans? Do you think that this supports SARS-CoV-2’s higher infectivity compared to SARS-CoV?
Contact maps
Exercise: In our GNM tutorial, we created the contact map using a threshold distance of 20 angstroms. Try making the contact map of one of the chains of SARS-CoV-2 spike protein 6vxx using thresholds of 10 angstroms and 40 angstroms. How different are the resulting contact maps?
