 Leanpub
In part 1 of this module, we used a variety of existing software resources to predict the structure of the SARS-CoV-2 spike protein from its amino acid sequence. We then discussed how to compare our predicted structures against the experimentally confirmed structure of the protein.
Now begins part 2, in which we examine how the structure of the SARS-CoV-2 spike protein compares against the SARS-CoV spike protein. In keeping with the biological maxim that the structure of a protein informs the function of that protein, can we find any clues lurking in the spike proteins’ structure that would indicate why the two viruses had different fates?
Focusing on a variable region of interest in the spike protein
In part 1, we saw that the spike protein is much more variable than other regions of the coronavirus genome. We even see variable and conserved regions within the spike protein, as the following figure (reproduced from the section on homology modeling) indicates.
 Variable and conserved regions in the SARS-CoV and SARS-CoV-2 spike proteins. The S1 domain tends to be more variable, whereas the S2 domain is more conserved.
One variable spike protein region is the receptor binding motif (RBM), part of the receptor binding domain (RBD), whose structure we predicted using GalaxyWEB in the homology modeling tutorial. The RBM mediates contact with ACE2, as the following simplified animation of the process illustrates.
The fact that the region binding to the target human enzyme has mutated so much makes it a fascinating region of study. Do the mutations that SARS-CoV-2 has accumulated somehow make it easier for the virus to infect human cells?
The figure below shows an alignment of the 70 amino acid long RBM region from SARS-CoV and SARS-CoV-2.
 An alignment of the RBM of the human SARS-CoV virus (first row) and the SARS-CoV-2 virus (second row). Amino acids that are highlighted in green represent matches between the two RBM sequences. Beneath each column, a bar illlustrates conservation between the two sequences, where full conservation indicates a match and partial conservation indicates a mismatch.
We already know from our previous work in this module that just because the sequence of a protein has been greatly mutated does not mean that the structure of that protein has changed much. Therefore, in this lesson, we will start a structural comparison of the SARS-CoV and SARS-CoV-2 spike proteins. All of this analysis will be performed using the software resources ProDy and VMD.
In addition to verifying the structure of the spike protein in both SARS-CoV and SARS-CoV-2, researchers also determined the structure of the RBD complexed with ACE2 in both SARS-CoV (PDB entry: 2ajf) and SARS-CoV-2 (PDB entry: 6vw1).
Because we know the structures of the bound complexes, we can produce 3-D visualizations of the two different complexes and look for structural differences involving the RBM. We will use VMD to produce this visualization, rotating the structures around to examine potential differences. However, we should be wary of only trusting our eyes to guide us; how can a quantitative approach tell us where to look for structural differences between the two RBMs?
Note: The experimentally verified SARS-CoV-2 structure is a chimeric protein formed of the SARS-CoV RBD in which the RBM has the sequence from SARS-CoV-2 1. A chimeric RBD was used for complex technical reasons to ensure that the crystallization process during X-ray crystallography could be borrowed from that used for SARS-CoV.
Contact maps visualize global structural differences
Recall from part 1 the definition of RMSD for two protein structures s and t, in which each structure is represented by the positions of its n alpha carbons (s1, …, sn) and (t1, …, tn).
\[\text{RMSD}(s, t) = \sqrt{\dfrac{1}{n} \cdot (d(s_1, t_1)^2 + d(s_2, t_2)^2 + \cdots + d(s_n, t_n)^2)}\]If two similar protein structures differ in a few locations, then the corresponding alpha carbon distances d(si, ti) will likely be higher at these locations. However, one of the weaknesses of RMSD that we pointed out in part 1 of this module is that a change to a single bond angle at the i-th position may cause d(sj, tj) to be nonzero when j > i, even though the structure of the protein downstream of this bond angle has not changed. For example, when we discussed the Kabsch algorithm, we showed the figure below of two protein structures that are identical except for a single bond angle. All of the alpha carbon distances d(si, ti) for i at least equal to 4 will be thrown off by this changed angle.
 Two toy protein structures in which the bond angle between the third and fourth alpha carbon has been changed. This change does not affect the distance between the i-th and j-th alpha carbons when i and j are both at least equal to 4.
However, note that when i and j are both at least equal to 4, the distance d(si, sj) between the i-th and j-th alpha carbons in S will still be similar to the distance d(ti, tj) between the same alpha carbons in T. This observation leads us to a more rigorous approach for measuring differences in two protein structures, which compares all pairwise intraprotein distances d(si, sj) in one protein structure against the corresponding distances d(ti, tj) in the other structure.
To help us visualize all these pairwise distances, we will introduce the contact map of a protein structure s, which is a binary matrix indicating whether two alpha carbons are near each other in s. After setting a threshold distance, we set M(i, j) = 1 if the distance d(si, sj) is less than the threshold, and we set M(i, j) = 0 if d(si, sj) is greater than or equal to the threshold.
The figure below illustrates the contact maps for both full proteins and single chains of the SARS-CoV-2 and SARS-CoV spike proteins, using a threshold distance of twenty angstroms. We color each contact map cell black if it is equal to 1 (corresponding to close amino acid pairs) and white if it is equal to 0 (corresponding to distant amino acid pairs).
Note: Interested in learning how to make contact maps? We will use ProDy to do so in a later section.
We observe two facts about these contact maps. First, many black values cluster around the main diagonal of the matrix, since amino acids that are nearby in a protein’s sequence will remain near each other in the protein’s structure. Second, the contact maps for the two proteins are very similar, reinforcing that the two proteins have similar structures. Contact map regions that differ provide regions for further investigation when comparing two proteins structurally.
 The contact maps of the SARS-CoV-2 spike protein (top left), SARS-CoV spike protein (top right), single chain of the SARS-CoV-2 spike protein (bottom left), and single chain of the SARS-CoV spike protein (bottom right). If the distance between the i-th and j-th amino acids in a protein structure is 20.0 angstroms or less, then the (i, j)-th cell of the figure is colored black. The SARS-CoV-2 and SARS spike proteins have very similar contact maps, indicating that they have similar structures.
STOP: How do you think a contact map will change as we increase or decrease the threshold distance used to produce that map?
Qres measures local structural differences
We obtain some insight into how two proteins differ structurally at the i-th amino acid if we examine the values in the i-th row of the proteins’ contact maps; that is, if we compare all of the d(si, sj) values to all of the d(ti, tj) values. In practice, researchers combine all of this information into a single metric called Q per residue (Qres) measuring the similarity of two structures at the i-th amino acid. The formal definition of Qres for two structures s and t having N amino acids is2
\[Q_{res}^{(i)} = \dfrac{1}{N-k} \sum^{N}_{j\neq i-1,i,i+1} \textrm{exp}[-\dfrac{[d(s_i,s_j)-d(t_i,t_j)]^2}{2\sigma^2_{i,j}}]\, .\]In this equation, exp(x) denotes ex. This equation also includes the following parameters.
- k is equal to 2 at either the start or the end of the protein (i.e., i is equal to 1 or N), and k is equal to 3 otherwise.
- The variance term \(\sigma_{ij}^2\) is equal to \(\left\lvert{i-j}\right\rvert ^{0.15}\), which corresponds to the sequence separation between the i-th and j-th alpha carbons.
Note: The above definition assumes that the two proteins have the same length or have been pre-processed by removing amino acids that only occur in one protein. Generalizations of Qres for proteins of non-equal length first align the sequences of two proteins and retain only those amino acids for structural comparison that are shared by the two proteins.
If two proteins are very similar at the i-th alpha carbon, then for every j, the difference d(si, sj) - d(ti, tj) will be close to zero, meaning that each term inside the summation in the Qres equation will be close to 1. The sum will be equal to approximately N - k, and so Qres will be close to 1. As two proteins become more different at the i-th alpha carbon, then the term inside the summation will head toward zero, and so will the value of Qres.
Qres is therefore a metric of similarity ranging between 0 and 1. Low Qres scores indicate that two proteins differ structurally at the i-th position, and high scores indicate that the two proteins are similar structurally at this position.
We now will compute Qres for the SARS-CoV and SARS-CoV-2 spike proteins using the VMD plugin Multiseq, a bioinformatics analysis environment. After determining Qres, we will visualize the individual locations where the two RBD regions differ.
Local comparison of spike proteins leads us to a region of interest
By computing Qres at every position of the two coronavirus RBD regions, we can form a structural alignment of the two regions, as shown in the figure below. Blue columns correspond to amino acids with high Qres (meaning high structural similarity), and red columns correspond to amino acids with low Qres (meaning low structural similarity). If we zoom in on the region around position 150 of the alignment, we find a 13-column region of the alignment within the RBD region for which Qres values are significantly lower than they are elsewhere. This region corresponds to positions 476 to 485 in the SARS-CoV-2 spike protein, which is part of the RBM.
 A snapshot of the sequence alignment between the SARS-CoV RBD (first row) and the SARS-CoV-2 chimeric RBD1 (second row). Columns are colored along a spectrum from blue (high Qres) to red (low Qres), with positions that correspond to an inserted or deleted amino acid colored red. The region with low Qres corresponds to amino acids at positions 476 to 485 in the SARS-CoV-2 spike protein.
The figure below shows a 3-D visualization of the ACE2 enzyme (green) bound with the superimposed structures of both the SARS-CoV and SARS-CoV-2 RBD. The same color-coding of columns of the multiple alignment in the figure above is used to color positions in the superimposed RBDs. The low-Qres region of the RBM alignment that we highlighted in the above figure is outlined in the figure below.
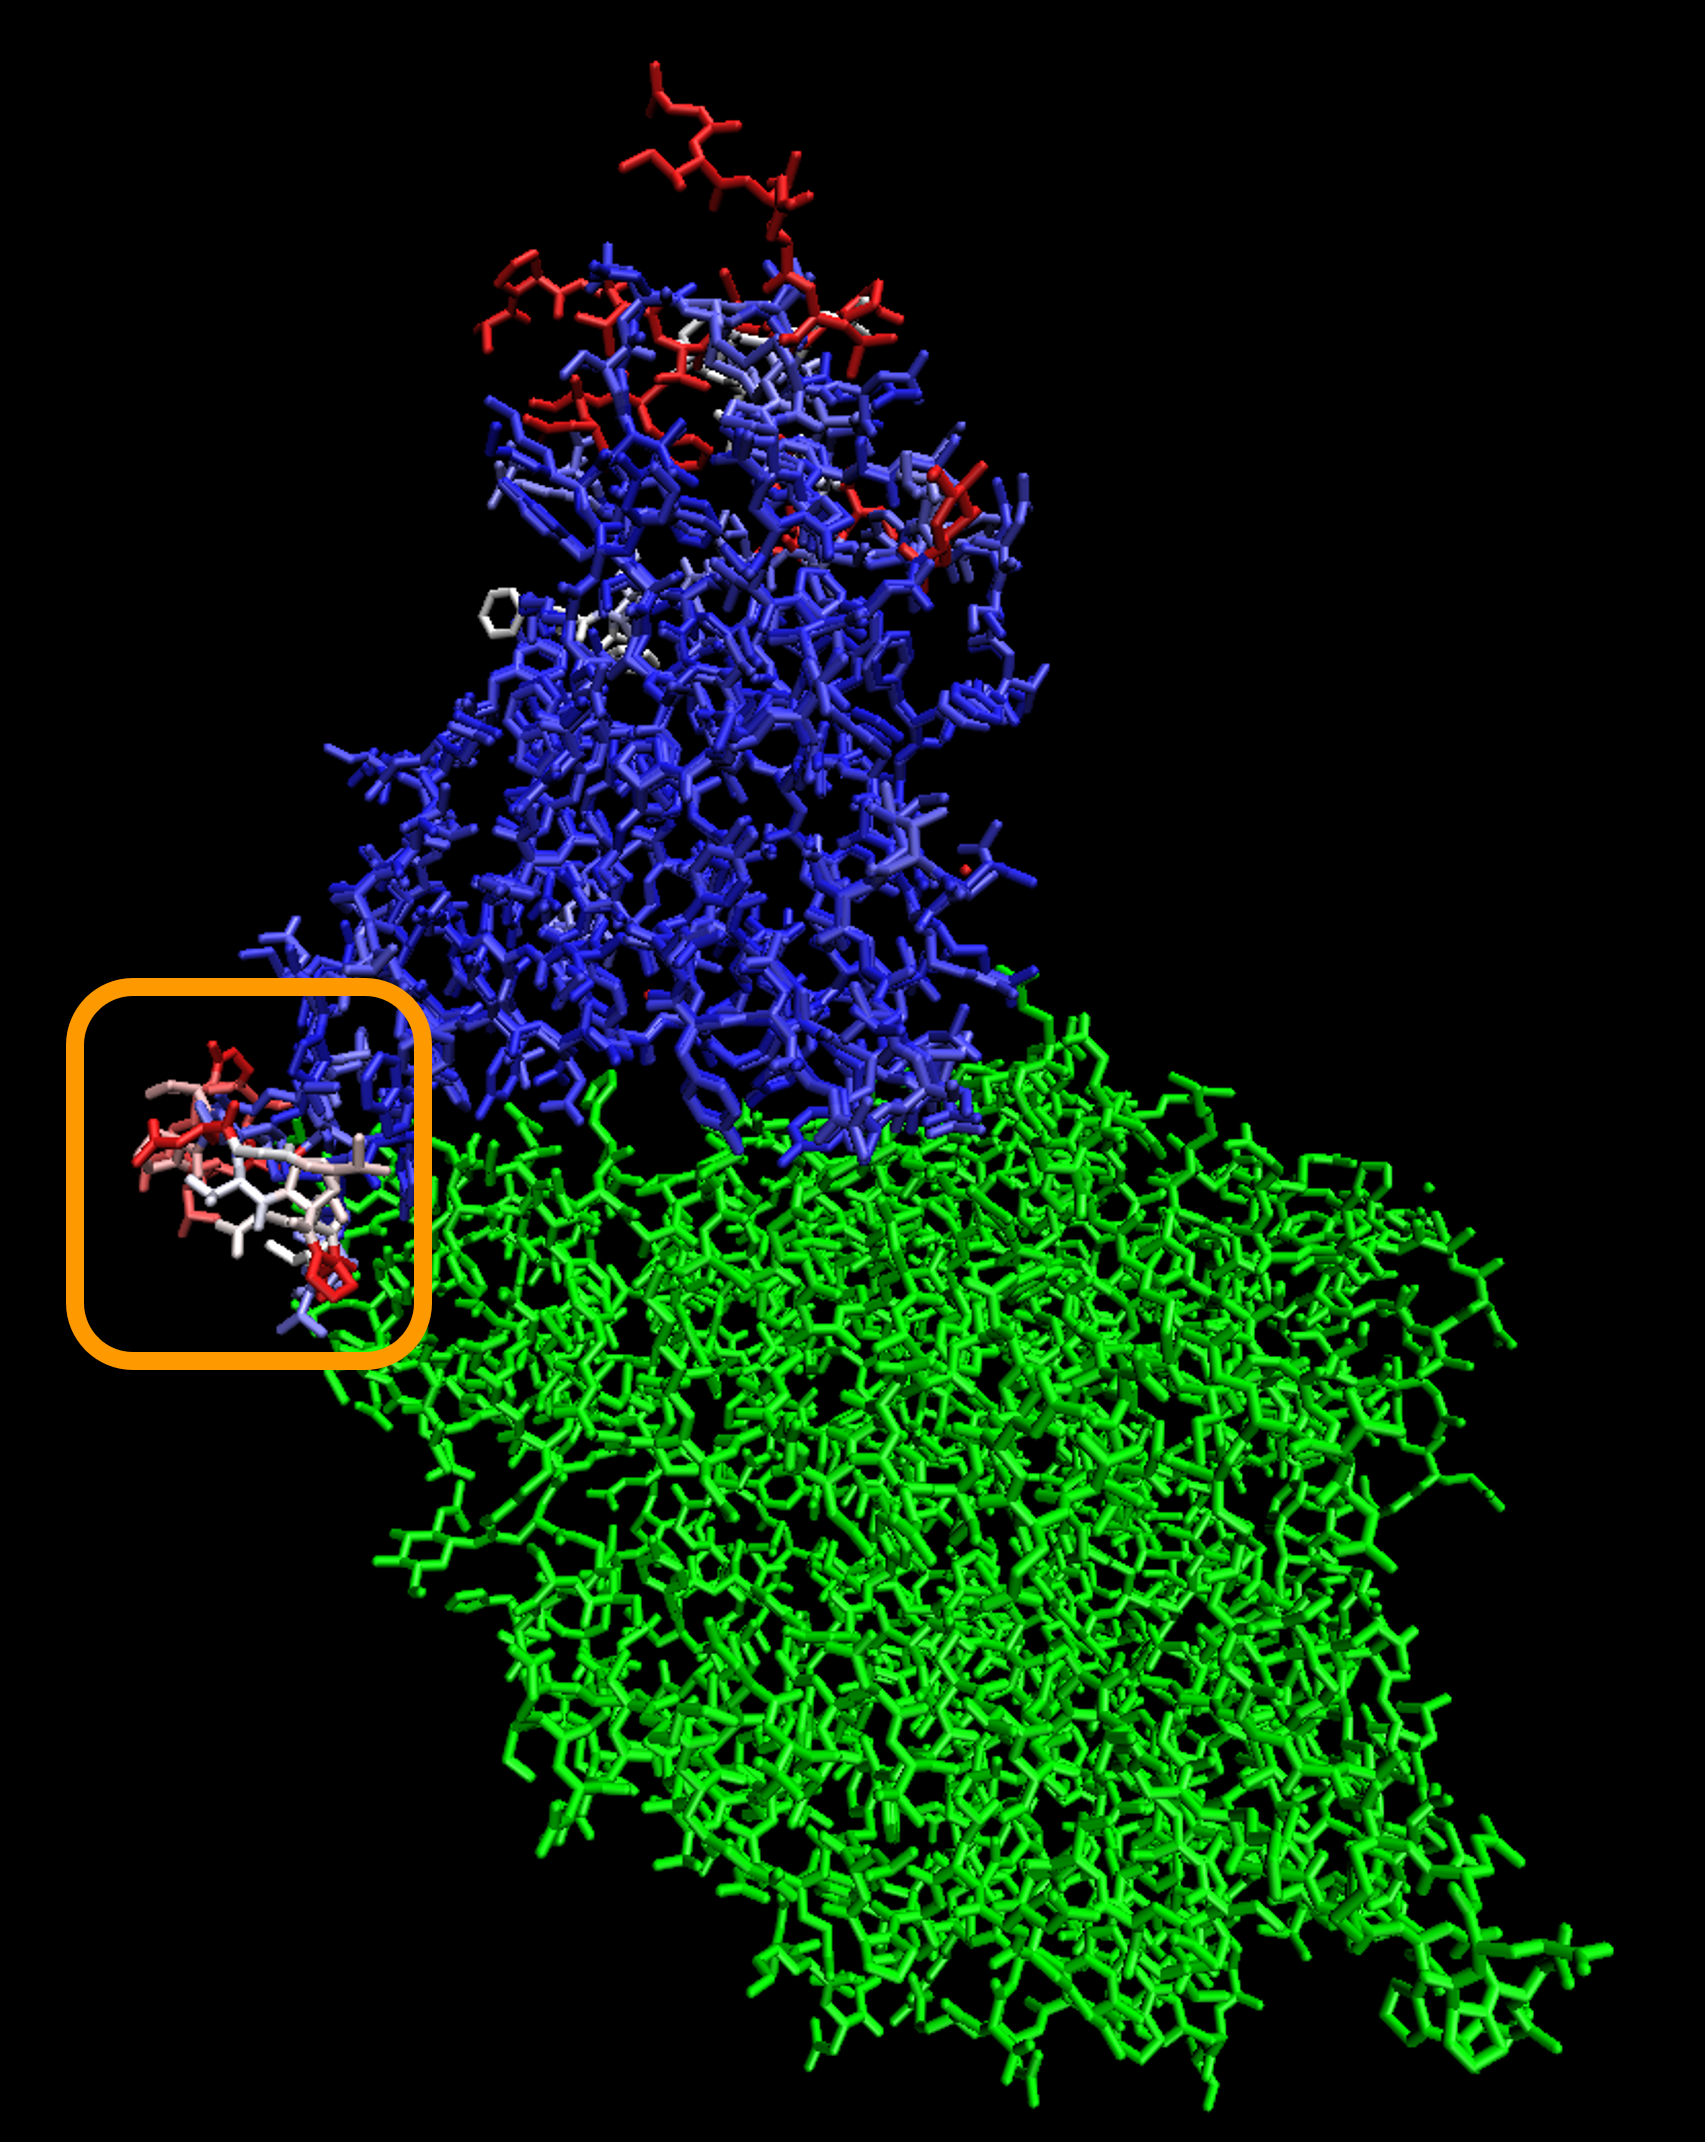 A visualization showing the superimposed structures of the SARS-CoV-2 chimeric RBD1 and SARS-CoV RBD, with individual amino acids colored blue or red depending on whether Qres is high or low, respectively. The ACE2 enzyme is shown in green. The boxed region corresponds to the part of the RBM having a potential structural difference. Because this region is adjacent to ACE2, the structural difference will likely affect ACE2 interactions.
Note: Although the rest of the proteins are similar, there are other parts of the RBD at the top of the protein that show dissimilarities in the two proteins, which may be attributable to an experimental artifact.
Finding a region in the RBM where the structures of the SARS-CoV and SARS-CoV-2 spike proteins differ presents an exciting development. We will next explore this region of the protein structure to determine whether the mutations acquired by SARS-CoV-2 may have influenced the binding affinity of the spike protein with the human ACE2 enzyme.
-
Shang, J., Ye, G., Shi, K., Wan, Y., Luo, C., Aijara, H., Geng, Q., Auerbach, A., Li, F. 2020. Structural basis of receptor recognition by SARS-CoV-2. Nature 581, 221–224. https://doi.org/10.1038/s41586-020-2179-y ↩ ↩2 ↩3
-
Li, L., Sethi, A., Luthey-Schulten, Z. Evolution of Translation Class I Aminoacyl-tRNA Synthetase:tRNA complexes. University of Illinois at Urbana-Champaign, Luthey-Schulten Group, NIH Resource for Macromolecular Modeling and Bioinformatics, Computational Biophysics Workshop. https://www.ks.uiuc.edu/Training/Tutorials/TCBG-copy/evolution/evolution_tutorial.pdf ↩
