 Leanpub
Homology modeling finds a similar protein structure
In the previous lesson, we saw that ab initio structure prediction of a long protein like the SARS-CoV-2 spike protein can be time consuming and error prone. As we mentioned in the introduction to structure prediction, however, researchers have entered over 160,000 experimentally verified structure entries into the PDB. With every new structure that we identify, we gain a little more insight into nature’s magic protein folding algorithm. In homology modeling (also called comparative modeling), we use the information contained in known structures to help us predict the structure of a protein with unknown structure.
The structure of the SARS-CoV spike protein was determined in 2003. Assuming that the two proteins have similar structure, we will use SARS-CoV spike protein’s known structure as a guide to help us predict the structure of the SARS-CoV-2 spike protein. In other words, we restrict the search space to those structures that are similar to the SARS-CoV spike protein structure.
STOP: In the case of the SARS-CoV-2 spike protein, we already know that we want to use the SARS-CoV spike protein as a template. However, if we do not know which template to use before we begin, how could we find a candidate protein template?
A similar structure reduces the size of the search space
Once we have found a protein with potentially similar structure to our protein of interest, we need to use this known structure to predict the structure of our protein. One way of doing so is to include a “similarity term” in the energy function that subtracts a structure’s similarity to the template structure from the structure’s total energy. That is, the more similar that a candidate structure is to the template, the more negative the contribution of this similarity term. To continue our search space analogy, the template protein “pulls down” the energy values of nearby structures like a gravity well.
Another way to perform homology modeling is to account for variance in similarity across different regions of the two proteins. The SARS-CoV and SARS-CoV-2 genomes are 96% similar, but their are only 76% similar. In general, when we examine genomes from related species, we see conserved regions where the species are very similar and variable regions where the species are more different than the average.
The phenomenon of conserved and variable regions also occurs within individual genes. The following figure shows that within a spike protein subunit, the S2 domain is 90% similar between the two viruses, whereas the S1 domain is only 64% similar. Furthermore, the S1 domain divides into two subunits of differing similarity.
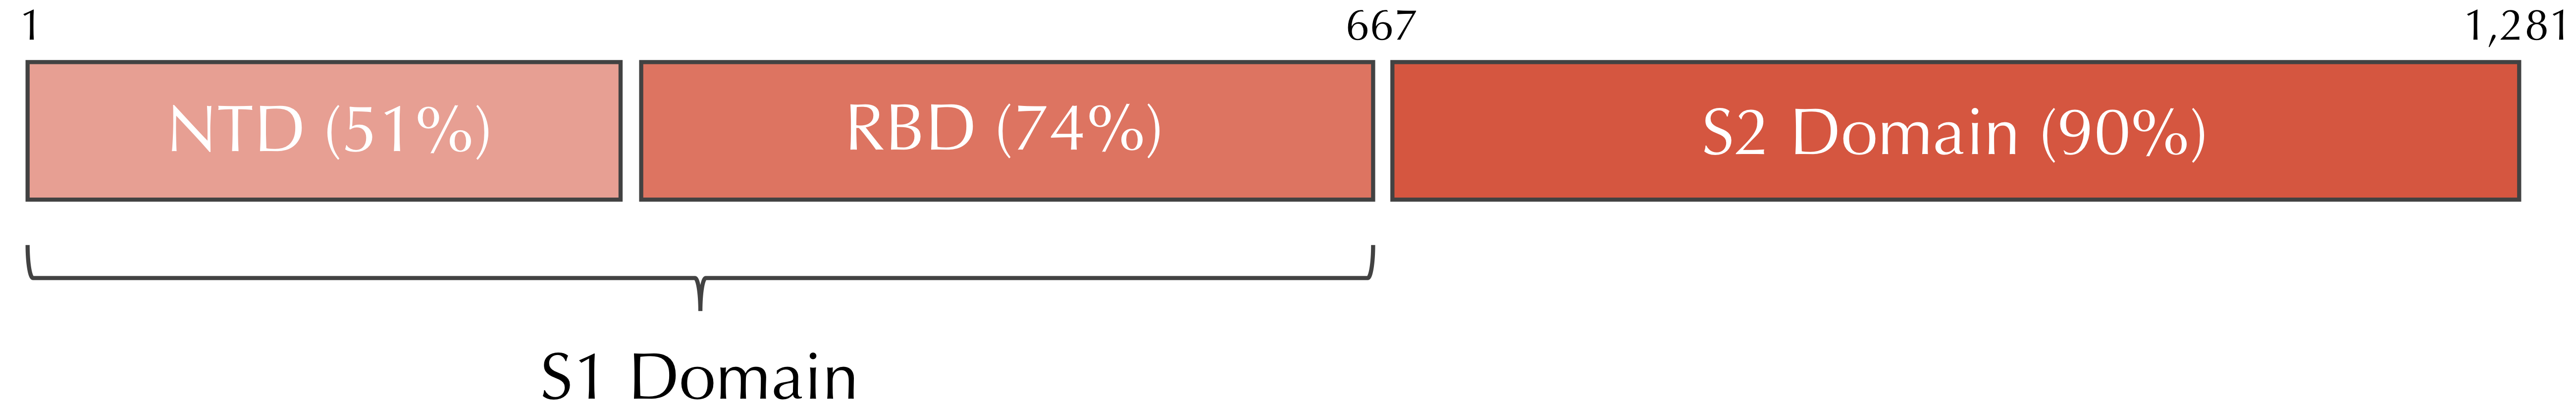 Variable and conserved regions in the SARS-CoV and SARS-CoV-2 spike proteins. The S1 domain tends to be more variable, whereas the S2 domain is more conserved. In this figure, “NTD” stands for “N-terminal domain” and “RBD” stands for “receptor binding domain”, two subunits of the S1 domain.
Some homology modeling algorithms account for variable and conserved regions by assuming that very conserved regions in the two genes correspond to essentially identical structures in the proteins. That is, the structure of our protein of interest in these regions will be the same as those of the template protein. We can then use a fragment library, a catalog of known substructures from many proteins, to fill in the structure of non-conserved regions based on structures of fragments whose sequence is similar to these regions. This approach is called fragment assembly.
We will model the SARS-CoV-2 spike protein using homology modeling software from three publicly available fragment assembly servers (SWISS-MODEL, Robetta, and GalaxyWEB). If the results are similar, then we have faith in the robustness of our predictions when using different approaches. Furthermore, comparing the results of multiple different approaches may give us more insights into structure prediction. If you are not interested in following this tutorial, links to the results can be found in the table below.
| Structure Prediction Server | Results |
|---|---|
| SWISS-MODEL (S protein) | SWISS-MODEL Results |
| Robetta (Single-Chain S protein) | Robetta Results |
| GalaxyWEB | GalaxyWEB Results |
Experiments determine the structure of the SARS-CoV-2 spike protein
On February 25, 2020, two months after the publication of the SARS-CoV-2 genome, researchers from the Seattle Structural Genomics Center for Infectious Disease published the result of a cryo-EM experiment for the SARS-CoV-2 spike protein, which became PDB entry 6vxx.
Note: If you would like to explore the structure of the SARS-CoV-2 spike protein, check out the 3-D protein viewer at https://www.rcsb.org/3d-view/6vxx.
We now turn to the problem of comparing our homology modeling results of the SARS-CoV-2 spike protein against the experimentally verified structure of SARS-CoV-2. How to compare two protein structures is a simple question, but it has a complicated answer, to which we will devote an entire section.
