Visualizing a region of structural differences
In the previous lesson, we identified a region between residues 476 and 485 of the SARS-CoV-2 spike protein that corresponds to a structural difference between the SARS-CoV-2 and SARS-CoV RBMs. We now wish to determine whether the differences we have found affect binding affinity with the human ACE2 enzyme.
We will first use VMD to highlight the amino acids in the region of interest of the SARS-CoV-2 spike protein’s structure.
Analyzing three sites of conformational differences
Shang et al.1 identified three sites showing significant conformational differences between the SARS-CoV-2 and SARS-CoV spike proteins. We will discuss each of these three locations and see how they affect binding affinity between the spike protein and ACE2.
Site 1: loop in ACE2-binding ridge
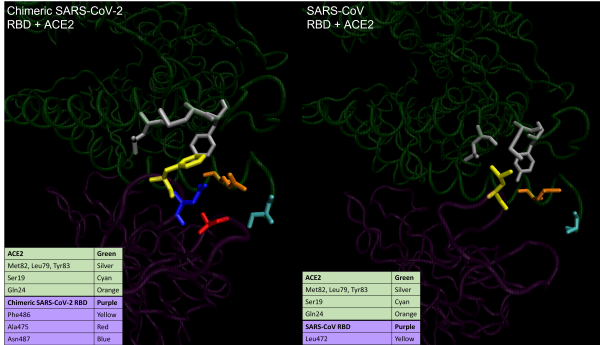
The first location is our region of interest from the previous lesson and is found on a loop in a region called the ACE2 binding ridge. This region is shown in the figure below, in which SARS-CoV-2 is on left and SARS-CoV is on the right.
Structural differences are challenging to show with a 2-D image, but if you followed the preceding tutorial, then we encourage you to use VMD to view the 3-D representation of the protein. Instructions on how to rotate a molecule and zoom in and out within VMD are given in our tutorial on finding local protein differences.
STOP: See if you can identify the major structural difference between the proteins in the figure below. Hint: look at the yellow residue.
 A visualization of the loop in the ACE2-binding ridge that is conformationally different between SARS-CoV-2 (left) and SARS-CoV (right). The coronavirus RBD is shown at the bottom in purple, and ACE2 is shown at the top in green. Structural differences cause certain amino acid residues, which are highlighted in various colors and described in the main text, to behave differently when ACE2 contacts each of the two viruses.
In what follows, we use a three-letter identifier for an amino acid followed by a number to indicate the identity of that amino acid followed by its position within the protein sequence. For example, the phenylalanine at position 486 of the SARS-CoV-2 spike protein will be called Phe486.
The most noticeable difference between SARS-CoV-2 and SARS-CoV in this region relates to a “hydrophobic pocket” of the three hydrophobic ACE2 residues Met82, Leu79, and Tyr83. This pocket, which is colored silver in the above figure, is hidden away from the outside of the ACE2 enzyme to keep these amino acids away from water. In SARS-CoV-2, Phe486 (colored yellow) inserts itself into the pocket, favorably interacting with ACE2. These interactions do not happen with SARS-CoV, and its corresponding RBD residue, Leu472, is not inserted into the pocket.1
Although the interaction with the hydrophobic pocket is the most critical difference between SARS-CoV-2 and SARS-CoV in this region, we highlight two other key differences. First, in SARS-CoV-2, a main-chain hydrogen bond forms between Asn487 (colored blue) and Ala475 (colored red), which creates a more compact ridge conformation, pushing the loop containing Ala475 closer to ACE2. This repositioning allows for the N-terminal residue Ser19 in ACE2 (colored cyan in the above figure) to form a hydrogen bond with the main chain of Ala475. Second, Gln24 in ACE2 (colored orange in the above figure) forms a new contact with the RBM.
Site 2: hotspot 31
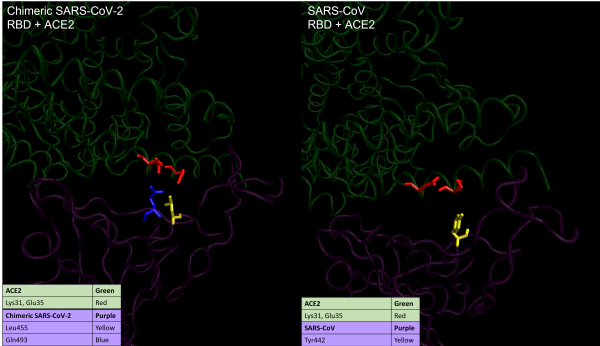
Hotspot 31 is not a failed Los Angeles nightclub but rather our second region of notable conformational differences between SARS-CoV-2 and SARS-CoV, which was studied in SARS-CoV as early as 200823. This location earns its name because it involves a salt bridge between Lys31 and Glu35 in ACE2, which is colored red in the figure below,.
STOP: Once again, see if you can spot the differences between SARS-CoV-2 and SARS-CoV.
 Visualizations of hotspot 31 in SARS-CoV-2 (left) and SARS-CoV (right). The coronavirus RBD is shown at the bottom in purple, and ACE2 is shown at the top in green. In SARS-CoV, hotspot 31 corresponds to a salt bridge (red), which is broken in SARS-CoV-2 to form a new hydrogen bond with Gln493 (blue)
The figure above shows how the salt bridge differs in the two viruses. In SARS-CoV, shown on the right, the two residues point towards each other because in the RBM, Tyr442 (colored yellow) supports the salt bridge between Lys31 and Glu35 on ACE2. In SARS-CoV-2, shown on the left, the corresponding amino acid is the less bulky Leu455 (yellow), which provides less support to Lys31. This causes the salt bridge to break, so that Lys31 and Glu35 in ACE2 point in parallel toward Gln493 (colored blue) on the RBD, forming hydrogen bonds with the spike protein.1.
Site 3: hotspot 353
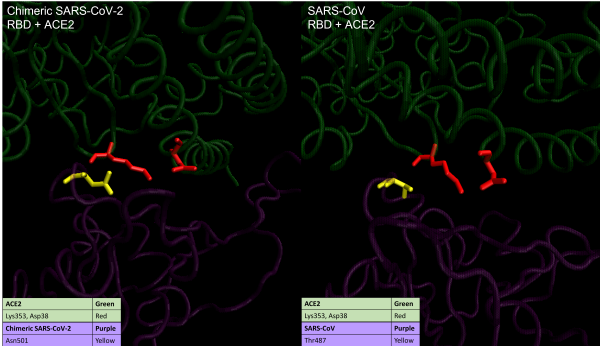
Finally, we consider hotspot 353, which involves another salt bridge, this one connecting Lys353 and Asp38 in ACE2. In this region, the difference between the residues is so subtle that it takes a keen eye to notice them in the figure below.
 Visualizations of hotspot 353 in SARS-CoV-2 (left) and SARS-CoV (right). The RBD is shown in purple, and ACE2 is shown in green. In SARS-CoV, the RBD residue Thr487 (yellow) stabilizes the salt bridge between ACE2 residues Lys 353 and Asp38 (red). In SARS-CoV-2, the corresponding RBD residue Asn501 (yellow) provides less support, causing ACE2 residue Lys353 (red residue on the left) to be in a slightly different conformation and form a new hydrogen bond with the RBD.1
In SARS-CoV, the methyl group of Thr487 (colored yellow in the right figure above) supports the salt bridge on ACE2, and the side-chain hydroxyl group of Thr487 forms a hydrogen bond with the RBM backbone. The corresponding SARS-CoV-2 amino acid Asn501 (colored yellow in left figure) also forms a hydrogen bond with the RBM main chain. However, similar to what happened in hotspot 31, Asn501 provides less support to the salt bridge, causing Lys353 on ACE2 (colored red) to be in a different conformation. This allows Lys353 to form an extra hydrogen bond with the main chain of the SARS-CoV-2 RBM while maintaining the salt bridge with Asp38 on ACE2.1
You may be wondering how researchers can be so fastidious that they would notice all these subtle differences between the proteins, even if they know where to look. The secret is that they have quantitative methods to aid their qualitative descriptions of how protein structure affects binding.
Computing the energy of a bound complex
In part 1 of this module, we searched for the tertiary structure that best “explains” a protein’s primary structure by looking for the structure with the lowest potential energy (i.e., the one that is the most chemically stable).
To quantify whether two molecules bind well, we will borrow this idea and compute the potential energy of the complex formed by the viral RBD and ACE2. If two molecules bind well, then the complex will have a very low potential energy. In turn, if we compare the SARS-CoV RBD-ACE2 complex against the SARS-CoV-2 RBD-ACE2 complex, and we find that the potential energy of the latter is significantly smaller, then we can conclude that it is more stable, providing evidence for the increased infectiousness of SARS-CoV-2.
In the following tutorial, we will compute the energy of the bound spike protein-ACE2 complex for the two viruses and see how the three regions that we identified in the previous lesson contribute to the total energy of the complex. To do so, we will employ NAMD, a program that was designed for high-performance large system simulations of biological molecules and is most commonly used with VMD via a plugin called NAMD Energy. This plugin will allow us to isolate a specific region to evaluate how much this local region contributes to the overall energy of the complex.
Differences in interaction energy with ACE2 between SARS and SARS-CoV-2
The table below shows the interaction energies for each of our three regions of interest as well as the total energy of the RBD-ACE2 complex for both SARS-CoV and SARS-CoV-2. The overall attractive interaction energy between the RBD and ACE2 is lower for SARS-CoV-2 than for SARS-CoV, which supports previous studies that have found the SARS-CoV-2 spike protein to have higher affinity with ACE2.
 ACE2 interaction energies of the chimeric SARS-CoV-2 RBD (left) and SARS-CoV RBD (right). The PDB files contain two biological assemblies, or instances, of the corresponding structure. The first instance includes chain A (ACE2) and chain E (RBD), and the second instance includes chain B (ACE2) and chain F (RBD). The overall interactive energies between the RBD and ACE2 are shown in the first two rows (green). Remaining rows show interaction energies for regions of interest: the loop site (yellow), hotspot 31 (red), and hotspot 353 (gray). Total energy is computed as the sum of electrostatic interactions and van der Waals (vdW) forces.
Furthermore, all three regions of interest have a lower total energy in SARS-CoV-2 than in SARS-CoV, with hotspot 31 (red) having the greatest negative contribution. We now have quantitative evidence that the conformational changes in the three sites do indeed increase the binding affinity between the spike protein and ACE2.
Nevertheless, we should be careful with making inferences about the infectiousness of SARS-CoV-2 based on these results. To add evidence for our case, we would need biologists to perform additional experiments.
Another reason for our cautiousness is that proteins are not fixed objects but rather dynamic structures whose shape is subject to small changes over time. We will now transition from the static study of proteins to the field of molecular dynamics, in which we simulate the movement of proteins’ atoms, along with their interactions as they move.
-
Shang, J., Ye, G., Shi, K., Wan, Y., Luo, C., Aijara, H., Geng, Q., Auerbach, A., Li, F. 2020. Structural basis of receptor recognition by SARS-CoV-2. Nature 581, 221–224. https://doi.org/10.1038/s41586-020-2179-y ↩ ↩2 ↩3 ↩4 ↩5
-
Li, F. 2008.Structural analysis of major species barriers between humans and palm civets for severe acute respiratory syndrome coronavirus infections. J. Virol. 82, 6984–6991. ↩
-
Wu, K., Peng, G., Wilken, M., Geraghty, R. J. & Li, F. 2012. Mechanisms of host receptor adaptation by severe acute respiratory syndrome coronavirus. J. Biol. Chem. 287, 8904–8911. ↩
