 Leanpub
Traveling up an attractant gradient
In the previous lesson, we saw that E. coli is able to adapt its default tumbling frequency to the current background concentration of attractant. To model this behavior, we used the Gillespie algorithm and the rule-based language of BioNetGen to simulate an instantaneous increase in concentration from one stable concentration level to another.
Yet imagine a glucose cube in an aqueous solution. As the cube dissolves, a gradient will form, with a glucose concentration that decreases outward from the cube. How will the tumbling frequency of E. coli change if the bacterium finds itself in an environment of an attractant gradient? Will the tumbling frequency decrease continuously as well, or will we see more complicated behavior? And once the cell reaches a region of high attractant concentration, will its default tumbling frequency stabilize to the same steady state?
In this lesson, we will modify our model from the previous lesson by increasing the concentration of the attractant ligand at an exponential rate and seeing how the concentration of phosphorylated CheY changes. This model will simulate a bacterium traveling up an attractant gradient toward an attractant. Moreover, we will examine how the concentration of phosphorylated CheY changes as we change the gradient’s “steepness”, or the rate at which attractant ligand is increasing. Visit the following tutorial if you’re interested in following our adjustments for yourself.
Steady state tumbling frequency is robust
To model a ligand concentration [L] that is increasing exponentially, we will use the function [L] = l0 · ek · t, where l0 is the initial ligand concentration, k is a constant dictating the rate of exponential growth, and t is the time. The parameter k represents the steepness of the gradient, since the higher the value of k, the faster the growth in the ligand concentration [L].
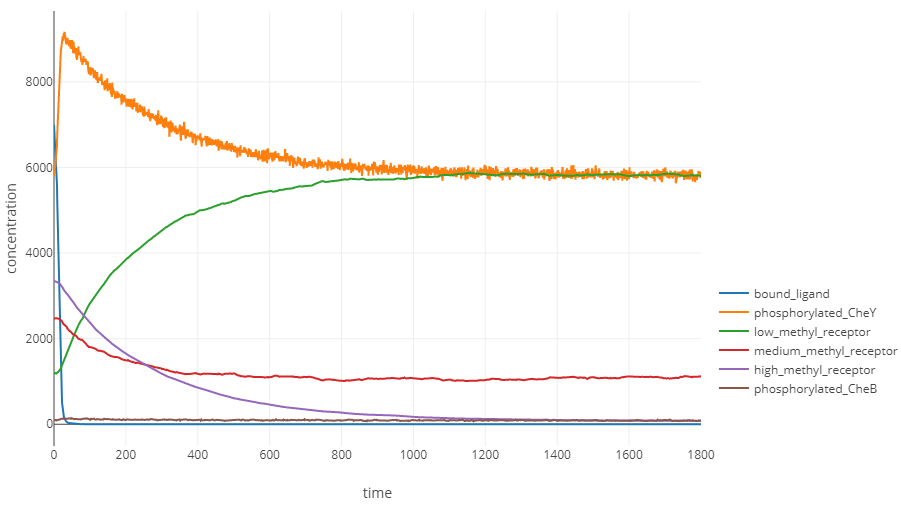
For example, the following figure shows the concentration over time of phosphorylated CheY (shown in blue) when l0 = 1000 and k = 0.1. The concentration of phosphorylated CheY, and therefore the tumbling frequency, still decreases sharply as the ligand concentration increases, but after all ligands become bound to receptors (shown by the plateau in the red curve), receptor methylation causes the concentration of phosphorylated CheY to return to its equilibrium. In other words, for these values of l0 and k, the outcome is similar to when we provided an instantaneous increase in ligand, although the cell takes longer to reach its minimum concentration of phosphorylated CheY because the attractant concentration is increasing gradually.
 Plots of relevant molecule concentrations in our model (in number of molecules in the cell) over time (in seconds) when the concentration of ligand grows exponentially with l0 = 1000 and k = 0.1. The concentration of bound ligand (shown in red) quickly hits saturation, which causes a minimum in phosphorylated CheY (and therefore a low tumbling frequency). To respond, the cell increases the methylation of receptors, which boosts the concentration of phosphorylated CheY back to equilibrium.
The following figure shows the results of multiple simulations in which we vary the growth parameter k and plot only the concentration of phosphorylated CheY over time. The larger the value of k, the faster the increase in receptor binding, and the steeper the drop in the concentration of phosphorylated CheY.
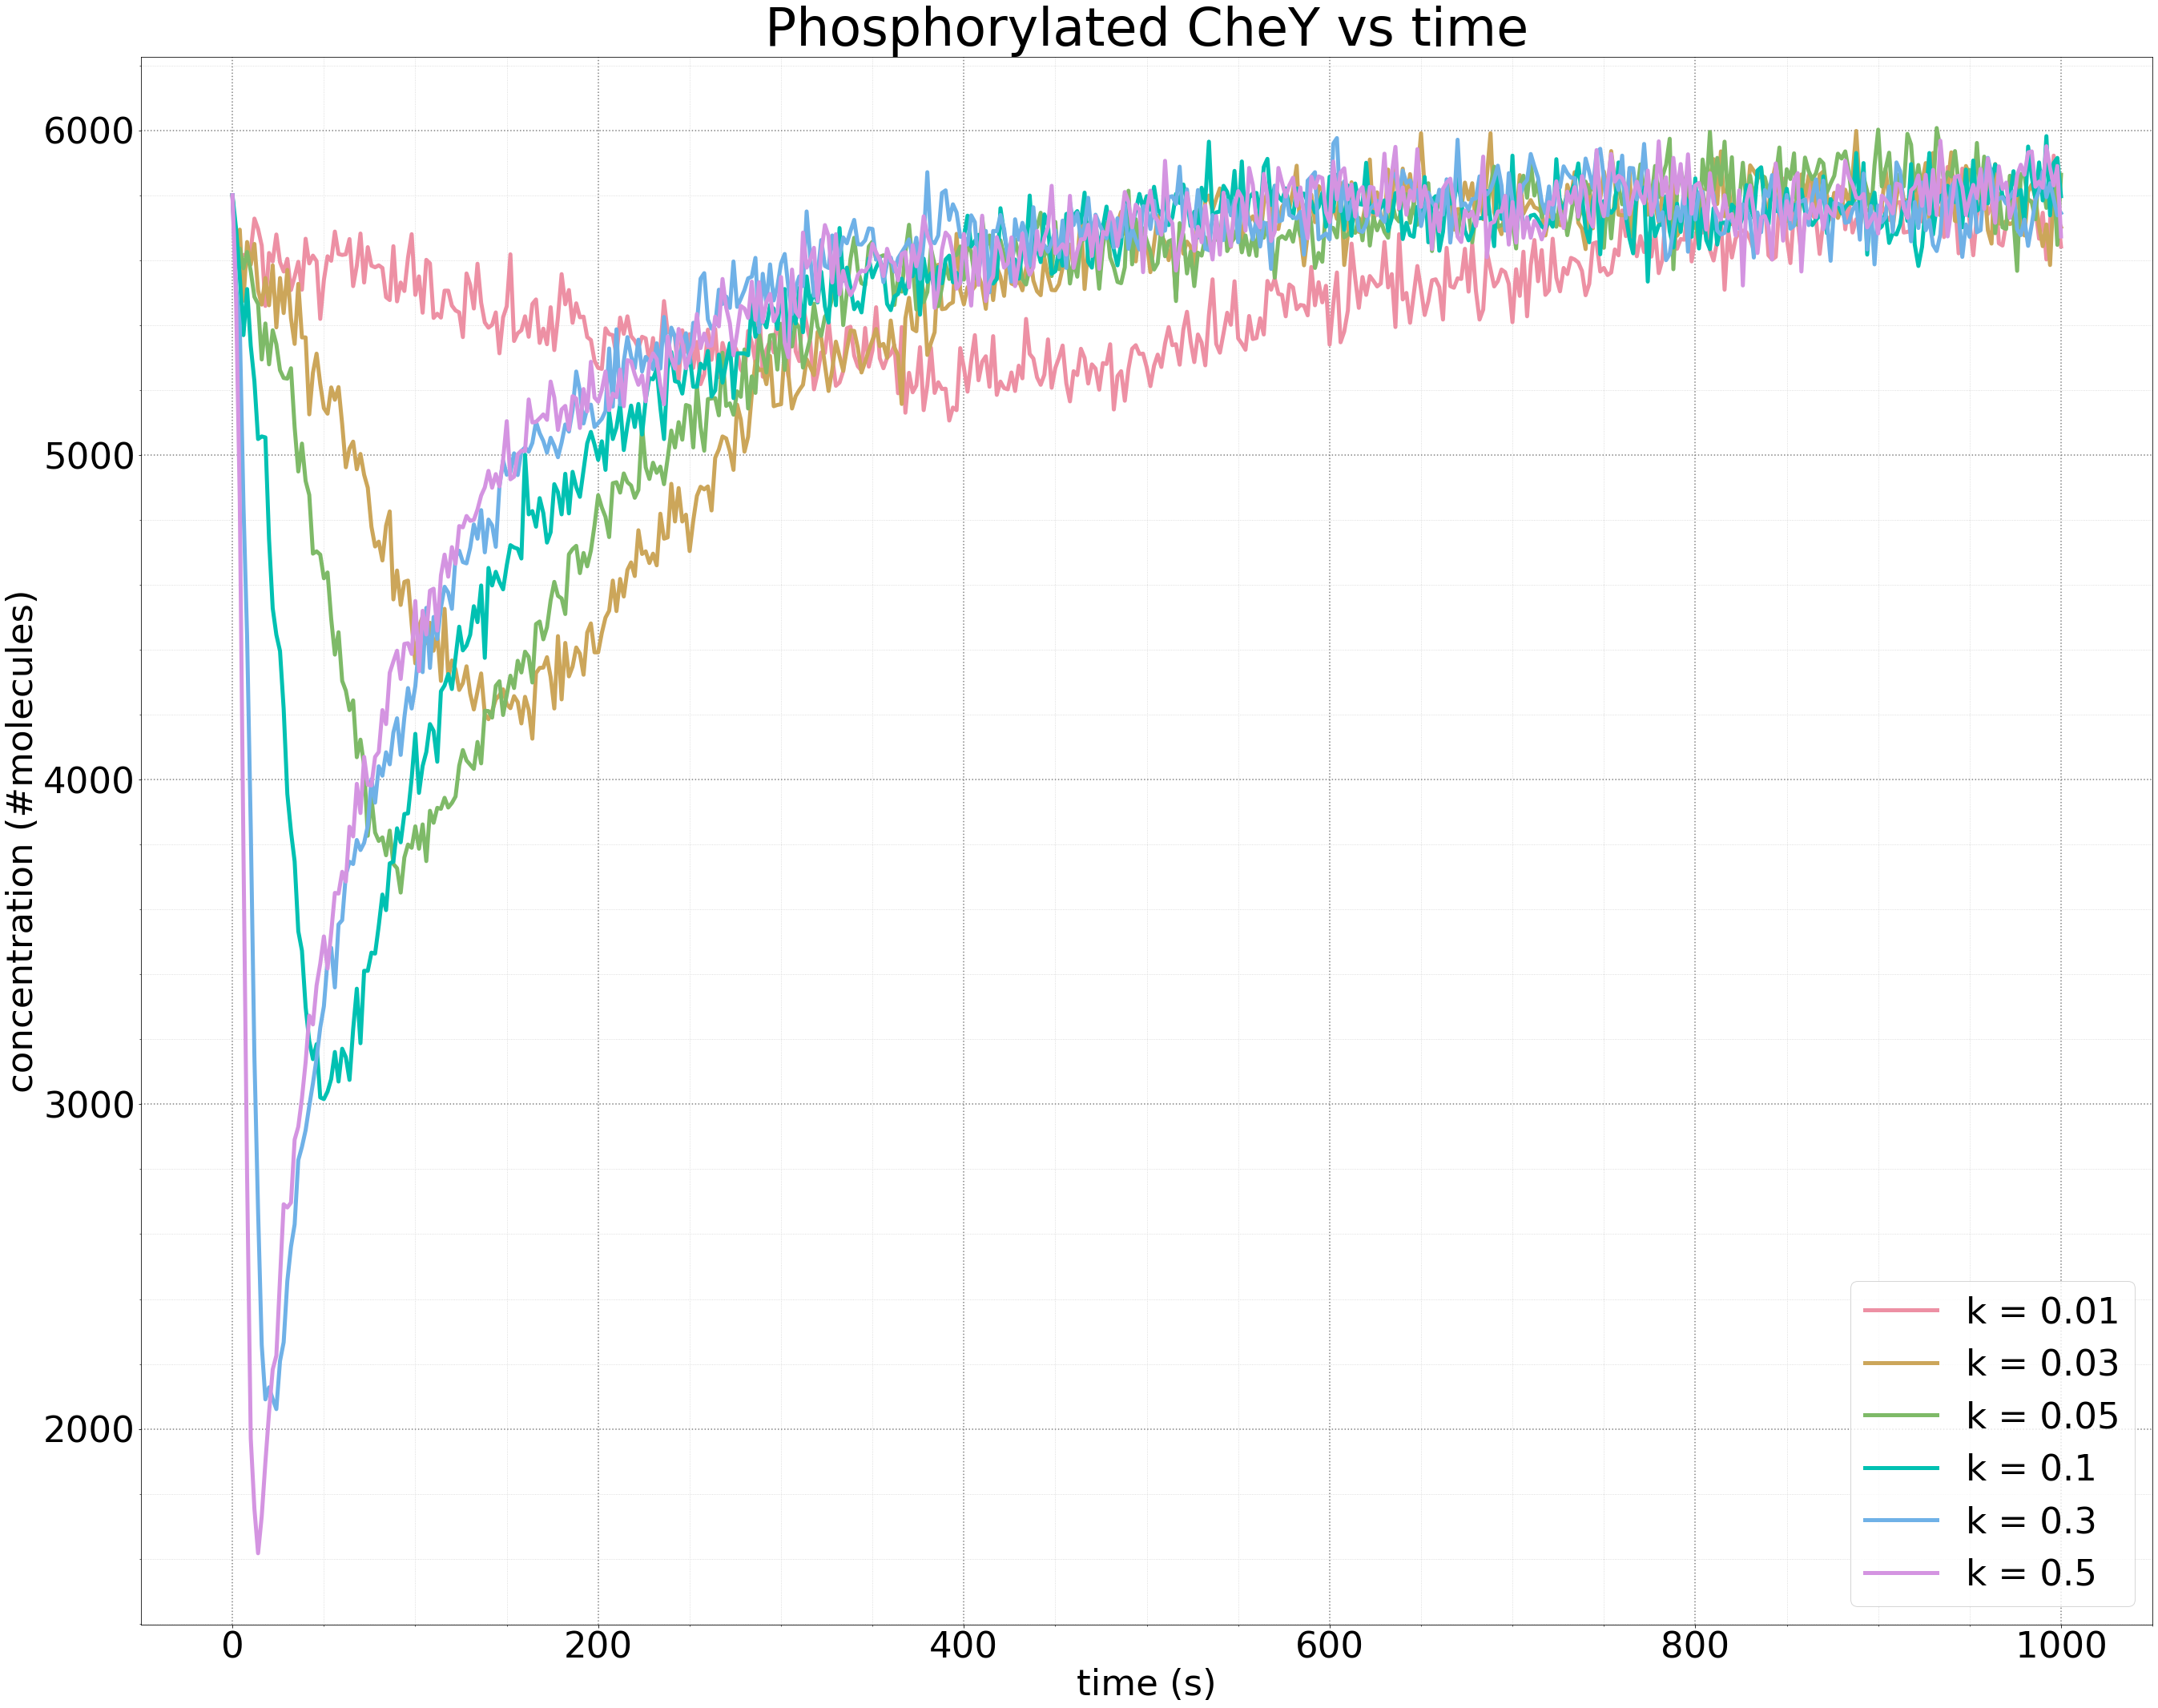 Plots of the concentration of phosphorylated CheY over time (in seconds) for different growth rates k of ligand concentration. The larger the value of k, the steeper the initial drop in the concentration of phosphorylated CheY, and the faster that methylation returns the concentration of phosphorylated CheY to equilibrium. The same equilibrium is obtained regardless of the value of k.
More importantly, the above figure further illustrates the robustness of bacterial chemotaxis to the rate of growth in ligand concentration. Whether the growth of the attractant is slow or fast, methylation will always bring the cell back to the same equilibrium concentration of phosphorylated CheY and therefore the same background tumbling frequency.
Reversing the attractant gradient
And what if a cell is moving away from an attractant, down a concentration gradient? We would hope that the cell would be able to increase its tumbling frequency (i.e., increase the concentration of phosphorylated CheY), and then restore the background tumbling frequency by removing methylation.
To simulate a decreasing gradient, we will model a cell in a high ligand concentration that is already at steady state, meaning that methylation is also elevated. In this case, the ligand concentration will decay exponentially, meaning that the ligand concentration is still given by the equation [L] = l0 · ek · t, but k is negative.
STOP: If k is negative, how do you think that decreasing the value of k will affect the concentration of phosphorylated CheY over time?
You may like to modify the previous tutorial on your own to account for traveling down an attractant gradient. If not, we are still happy to provide a separate tutorial below.
Steady state tumbling frequency remains robust when traveling down an attractant gradient
The following figure plots the concentrations of molecules in our model as the concentration of attractant ligand decreases exponentially with l0 equal to 107 and k equal to -0.3. As the ligand concentration decreases, the concentration of bound ligands plummet as bound ligands dissociate and there are not enough free ligands to replace the dissociating ones. In the absence of ligand-receptor binding, CheY is free to phosphorylate, causing a spike in phosphorylated CheY. Demethylation of receptors then causes the concentration of phosphorylated CheY to steadily return back to its equilibrium.
 Molecular concentrations (in number of molecules in the cell) over time (in seconds) for a simulated bacterium traveling down an attractant gradient with l0 = 107 and k equal to -0.3. Phosphorylated CheY follows the opposite pattern to traveling up an attractant gradient, with the concentration of phosphorylated CheY rising quickly only to slowly decrease to equilibrium due to demethylation.
To be thorough, we should also test the robustness of our model to see whether the CheY concentration will return to the same steady state for a variety of values of k when k is negative. As in the case of an increasing gradient, the figure below shows that the more sudden the change in the concentration of attractant (i.e., the more negative the value of k), the sharper the spike. And yet regardless of the value of k, methylation does its work to bring the concentration back to the same steady state, which has been confirmed by experimental observations.1
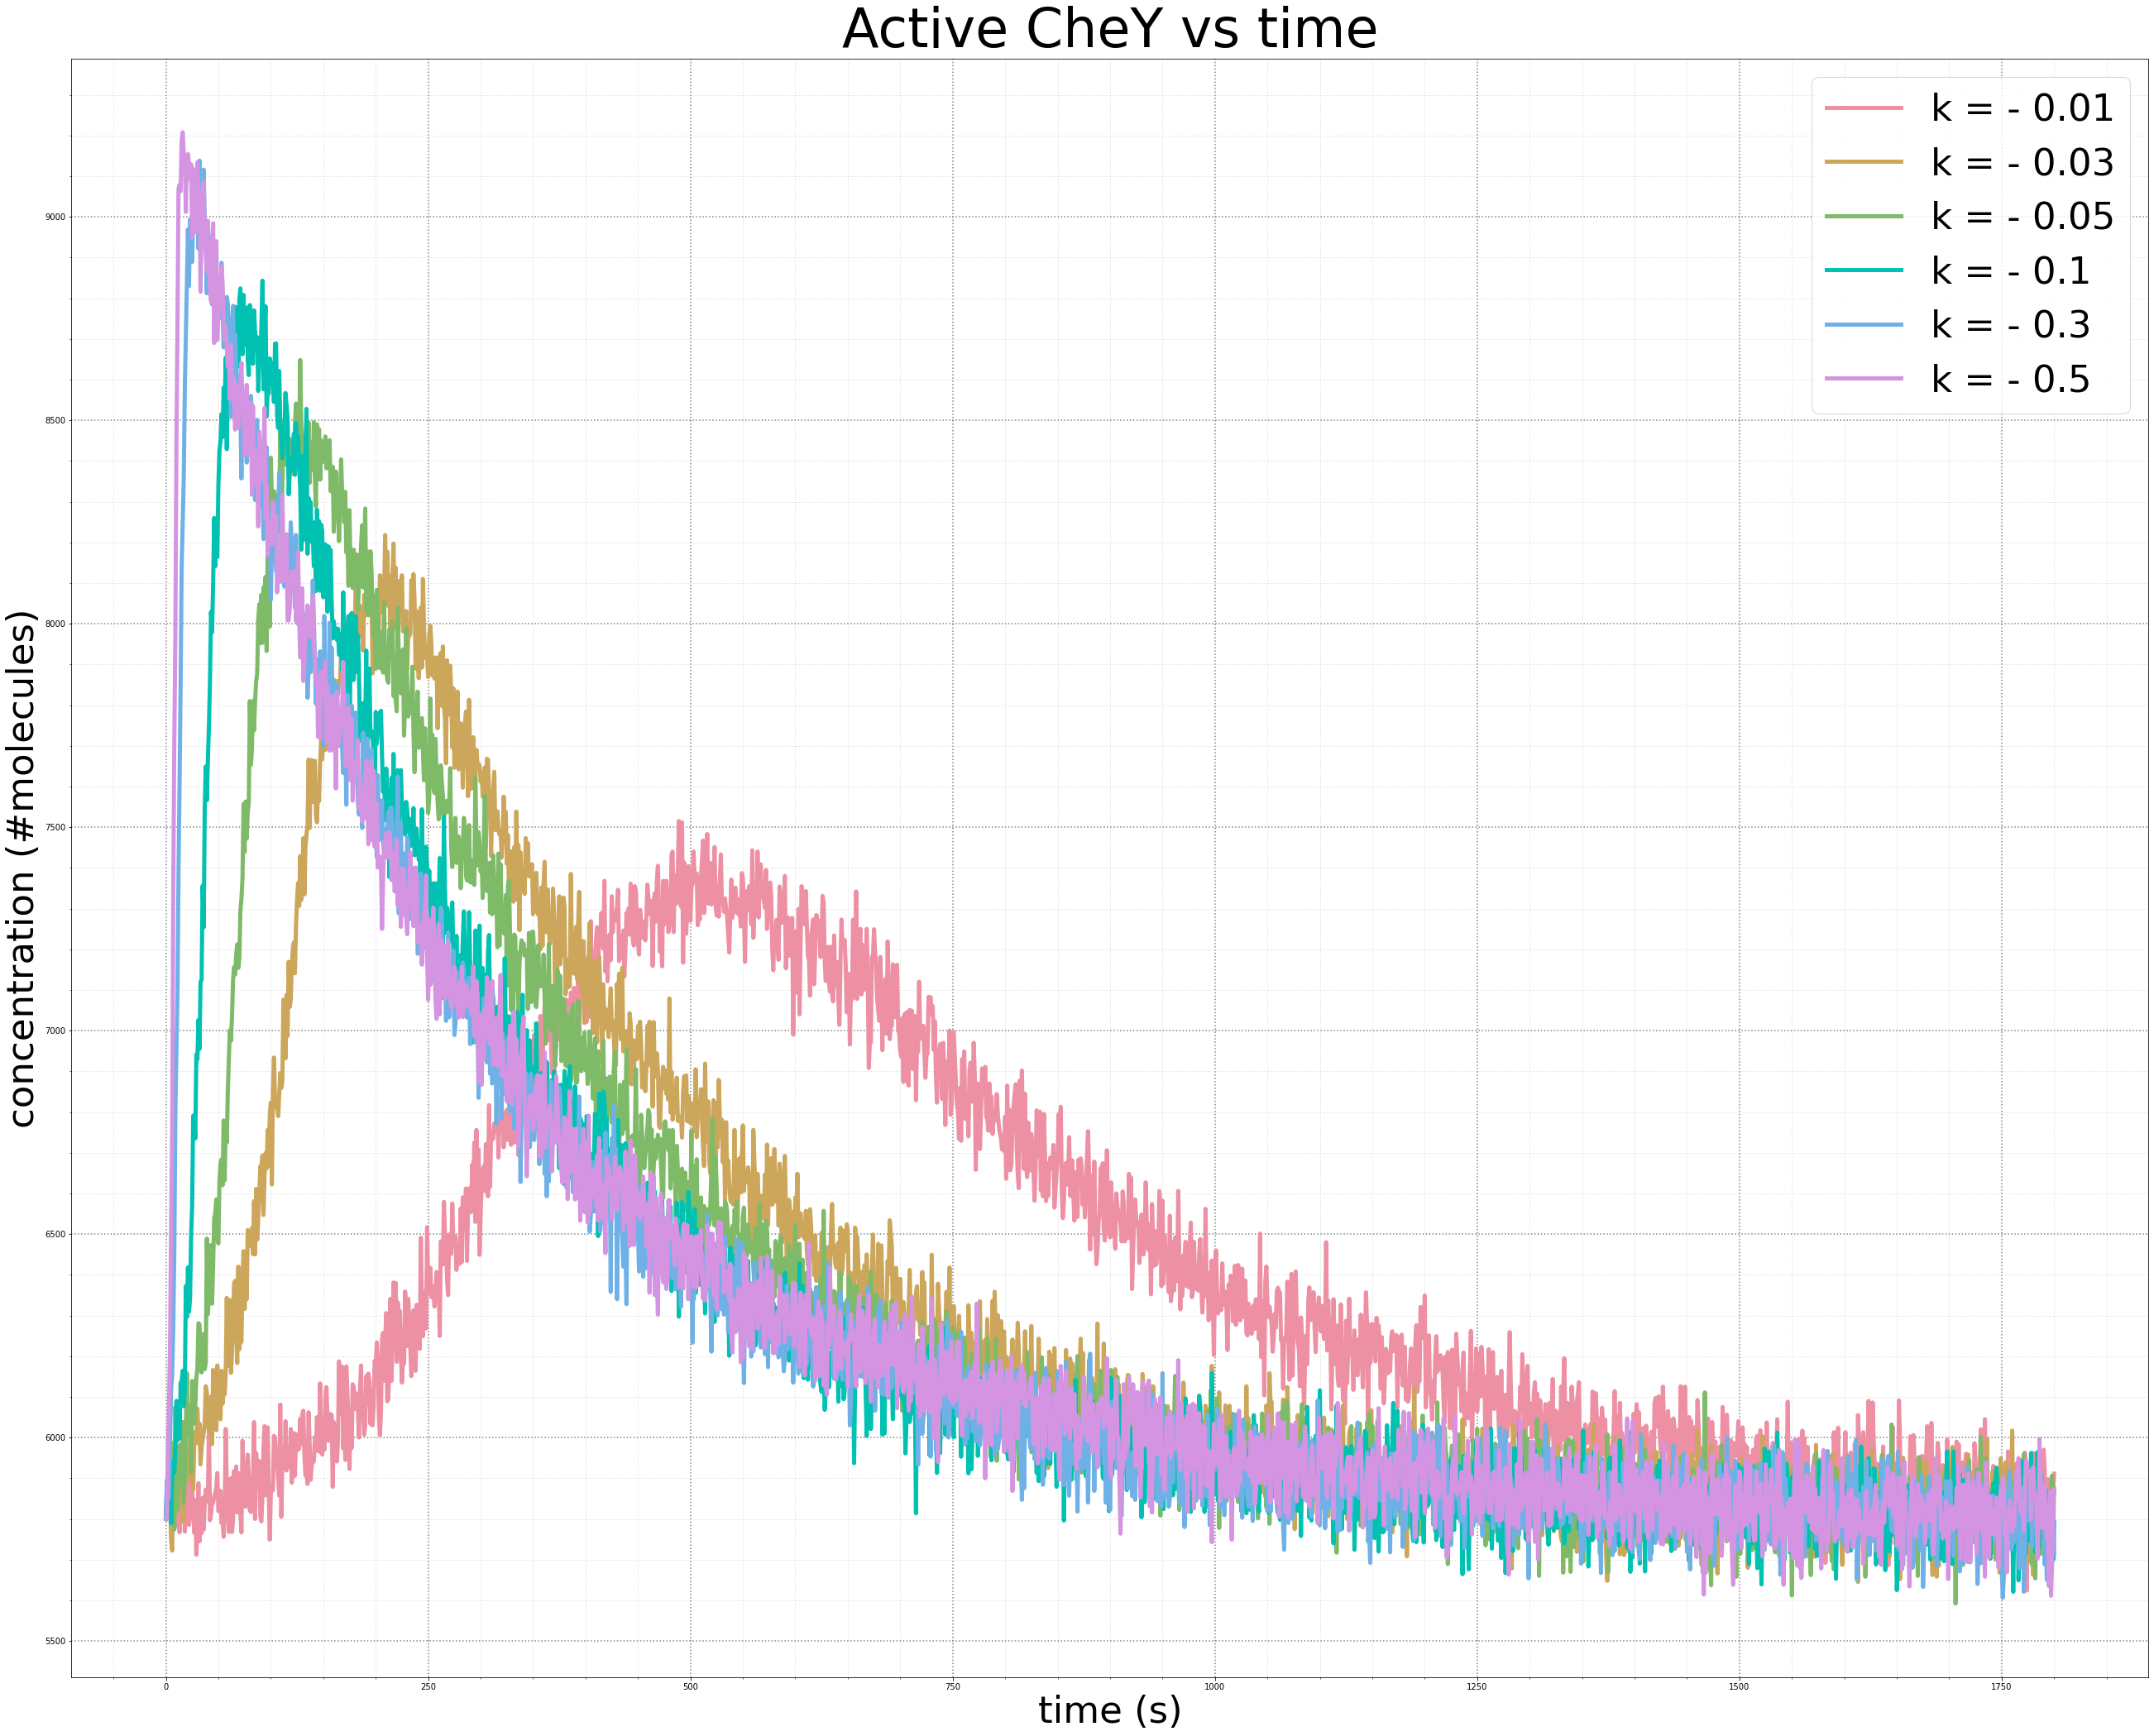 Varying values of k in our exponential decrease in the concentration of attractant ligand produce the same equilibrium concentration of phosphorylated CheY. The smaller the value of k, the steeper the initial spike, and the faster the recovery to steady state.
From changing tumbling frequencies to an exploration algorithm
We hope that our work here has conveyed the elegance of bacterial chemotaxis, as well as the power of rule-based modeling and the Gillespie algorithm for simulating a complex biochemical system that may include a huge number of reactions.
And yet we are missing an important part of the story. E. coli has evolved to ensure that if it detects a relative increase in concentration (i.e., an attractant gradient), then it can reduce its tumbling frequency in response. But we have not explored why changing its tumbling frequency would help a bacterium find food in the first place. After all, according to the run and tumble model, the direction that a bacterium is moving at any point in time is random!
This quandary does not have an obvious intuitive answer. In this module’s conclusion, we will build a model to explain why E. coli’s randomized run and tumble walk algorithm is such a clever way of locating resources in an unfamiliar land.
-
Krembel A., Colin R., Sourijik V. 2015. Importance of multiple methylation sites in Escherichia coli chemotaxis. Available online ↩
