 Leanpub
In this tutorial, we will extend the BioNetGen model covered in the phosphorylation tutorial to add the methylation mechanisms described in the main text to our ongoing model of bacterial chemotaxis. Our model will be based on the model by Spiro et al.1
We will also add compartmentalization to our model, which will allow us to differentiate molecules that occur inside and outside of the cell.
Finally, after running our model, we will see how methylation can be used to help the bacterium adapt to a relative change in attractant concentration. For reference, consult the figure below, reproduced from the main text, for an overview of the chemotaxis pathway.
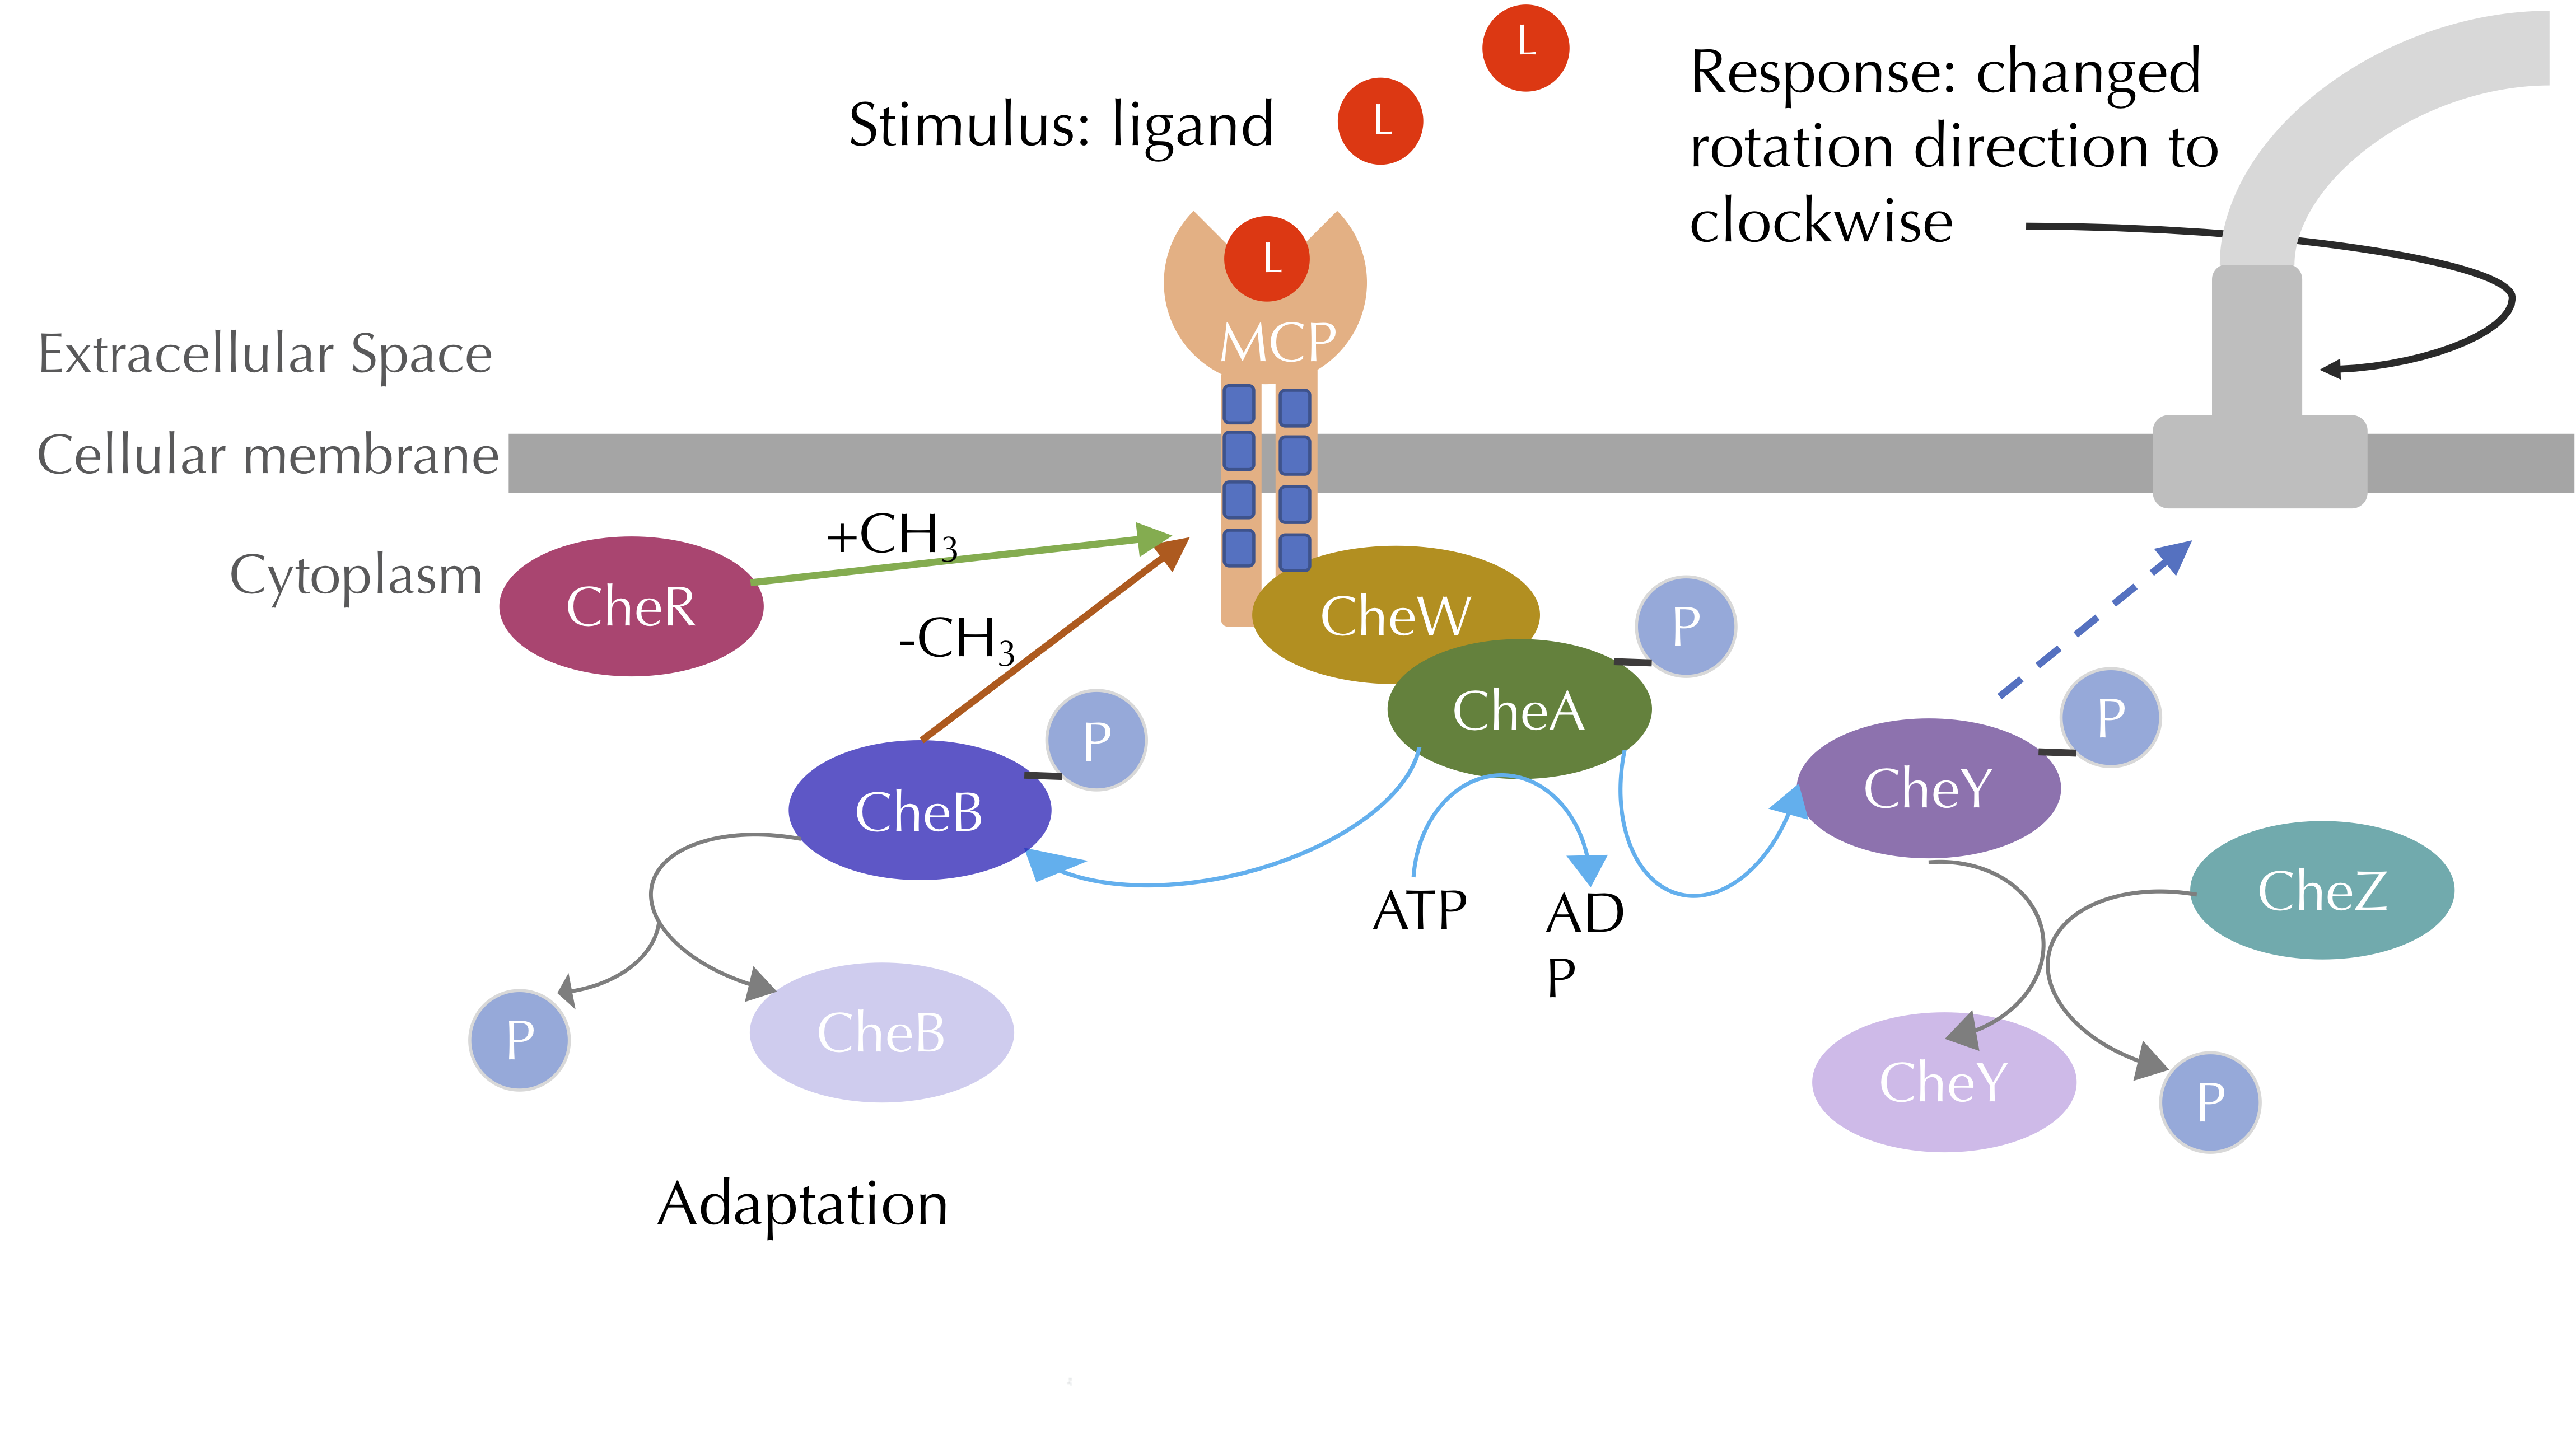 The chemotaxis signal-transduction pathway with methylation included. CheA phosphorylates CheB, which methylates MCPs, while CheR demethylates MCPs. Blue lines denote phosphorylation, grey lines denote dephosphorylation, and the green arrow denotes methylation. Image modified from Parkinson Lab’s illustrations.
To get started, open Visual Studio Code, and click File > Open Folder.... Open the EColiSimulations folder from the first tutorial. Create a copy of your file from the phosphorylation tutorial and save it as adaptation.bngl. If you would rather not follow along below, you can download a completed BioNetGen file here: adaptation.bngl.
Specifying molecule types
We first will add all molecules needed for our model. As mentioned in the main text, we will assume that an MCP can have one of three methylation states: low (A), medium (B), and high (C). We also need to include a component that will allow for the receptor to bind to CheR. As a result, we update our MCP molecule to T(l,r,Meth~A~B~C,Phos~U~P).
Furthermore, we need to represent CheR and CheB; recall that CheR binds to and methylates receptor complexes, while CheB demethylates them. CheR can bind to T, so that we will need the molecule CheR(t). CheB is phosphorylated by CheY, and so it will be represented as CheB(Phos~U~P). Later we will specify reactions specifying how CheR and CheB change the methylation states of receptor complexes.
begin molecule types
	L(t)
	T(l,r,Meth~A~B~C,Phos~U~P)
	CheY(Phos~U~P)
	CheZ()
	CheB(Phos~U~P)
	CheR(t)
end molecule types
In the observable section, we specify that we are interested in tracking the concentrations of the bound ligand, phosphorylated CheY and CheB, and the receptor at each methylation level.
begin observables
	Molecules bound_ligand L(t!1).T(l!1)
	Molecules phosphorylated_CheY CheY(Phos~P)
	Molecules low_methyl_receptor T(Meth~A)
	Molecules medium_methyl_receptor T(Meth~B)
	Molecules high_methyl_receptor T(Meth~C)
	Molecules phosphorylated_CheB CheB(Phos~P)
end observables
Defining reactions
We now expand our reaction rules to include methylation. First, we change the autophosphorylation rules of the receptor to have different rates depending on whether the receptor is bound and its current methylation level, which produces six rules.
Note: We cannot avoid combinatorial explosion in the case of these phosphorylation reactions because they take place at different rates.) In what follows, we use experimentally verified reaction rates.
#Receptor complex (specifically CheA) autophosphorylation
#Rate dependent on methylation and binding states
#Also on free vs. bound with ligand
TaUnboundP: T(l,Meth~A,Phos~U) -> T(l,Meth~A,Phos~P) k_TaUnbound_phos
TbUnboundP: T(l,Meth~B,Phos~U) -> T(l,Meth~B,Phos~P) k_TaUnbound_phos*1.1
TcUnboundP: T(l,Meth~C,Phos~U) -> T(l,Meth~C,Phos~P) k_TaUnbound_phos*2.8
TaLigandP: L(t!1).T(l!1,Meth~A,Phos~U) -> L(t!1).T(l!1,Meth~A,Phos~P) 0
TbLigandP: L(t!1).T(l!1,Meth~B,Phos~U) -> L(t!1).T(l!1,Meth~B,Phos~P) k_TaUnbound_phos*0.8
TcLigandP: L(t!1).T(l!1,Meth~C,Phos~U) -> L(t!1).T(l!1,Meth~C,Phos~P) k_TaUnbound_phos*1.6
Next, we will need reactions for CheR binding to receptor complexes and methylating them. First, we consider the binding of CheR to the receptor.
#CheR binding to receptor complex
TRBind: T(r) + CheR(t) <-> T(r!2).CheR(t!2) k_TR_bind, 1
Second, we will need multiple reaction rules for methylation of receptors by CheR because the rate of the reaction can depend on whether a ligand is already bound to the receptor as well as the current methylation level of the receptor. This gives us four rules, since a receptor at the “high” methylation level (C) cannot have increased methylation. Note also that the rate of the methylation reaction is higher if the methylation level is low (A) and significantly higher if the receptor is already bound.
#CheR methylating the receptor complex
#Rate of methylation is dependent on methylation states and ligand binding
TRBind: T(r) + CheR(t) <-> T(r!2).CheR(t!2) k_TR_bind, k_TR_dis
TaRUnboundMeth: T(r!2,l,Meth~A).CheR(t!2) -> T(r,l,Meth~B) + CheR(t) k_TaR_meth
TbRUnboundMeth: T(r!2,l,Meth~B).CheR(t!2) -> T(r,l,Meth~C) + CheR(t) k_TaR_meth*0.1
TaRLigandMeth: T(r!2,l!1,Meth~A).L(t!1).CheR(t!2) -> T(r,l!1,Meth~B).L(t!1) + CheR(t) k_TaR_meth*30
TbRLigandMeth: T(r!2,l!1,Meth~B).L(t!1).CheR(t!2) -> T(r,l!1,Meth~C).L(t!1) + CheR(t) k_TaR_meth*3
Finally, we need reactions for CheB. First, we consider its phosphorylation by the receptor and its autodephosphorylation. Each of these two reactions occurs at a rate that is independent of any other state of the receptor or CheB.
#CheB is phosphorylated by receptor complex, and autodephosphorylates
CheBphos: T(Phos~P) + CheB(Phos~U) -> T(Phos~U) + CheB(Phos~P) k_B_phos
CheBdephos: CheB(Phos~P) -> CheB(Phos~U) k_B_dephos
CheB also demethylates the receptor complex, at a rate that depends on the current methylation state. (We do not include state A since it cannot be further demthylated.)
#CheB demethylates receptor complex
#Rate dependent on methylation states
TbDemeth: T(Meth~B) + CheB(Phos~P) -> T(Meth~A) + CheB(Phos~P) k_Tb_demeth
TcDemeth: T(Meth~C) + CheB(Phos~P) -> T(Meth~B) + CheB(Phos~P) k_Tc_demeth
We are now ready to combine the above reaction rules with the reaction rules inherited from the original model (ligand-receptor binding and CheY phosphorylation/dephosphorylation) to give us a complete set of reaction rules. As pointed out in the main text, were we to write out all possible reactions that are implied from these rules, we would have an enormous model. BioNetGen takes the following rules and converts them into all necessary reactions for us behind the scenes.
begin reaction rules
  #Ligand-receptor binding
	LigandReceptor: L(t) + T(l) <-> L(t!1).T(l!1) k_lr_bind, k_lr_dis

  #CheY phosphorylation by T and dephosphorylation by CheZ
  YPhos: T(Phos~P) + CheY(Phos~U) -> T(Phos~U) + CheY(Phos~P) k_Y_phos
  YDephos: CheZ() + CheY(Phos~P) -> CheZ() + CheY(Phos~U) k_Y_dephos

	#Receptor complex (specifically CheA) autophosphorylation
	#Rate dependent on methylation and binding states
	#Also on free vs. bound with ligand
	TaUnboundP: T(l,Meth~A,Phos~U) -> T(l,Meth~A,Phos~P) k_TaUnbound_phos
	TbUnboundP: T(l,Meth~B,Phos~U) -> T(l,Meth~B,Phos~P) k_TaUnbound_phos*1.1
	TcUnboundP: T(l,Meth~C,Phos~U) -> T(l,Meth~C,Phos~P) k_TaUnbound_phos*2.8
	TaLigandP: L(t!1).T(l!1,Meth~A,Phos~U) -> L(t!1).T(l!1,Meth~A,Phos~P) 0
	TbLigandP: L(t!1).T(l!1,Meth~B,Phos~U) -> L(t!1).T(l!1,Meth~B,Phos~P) k_TaUnbound_phos*0.8
	TcLigandP: L(t!1).T(l!1,Meth~C,Phos~U) -> L(t!1).T(l!1,Meth~C,Phos~P) k_TaUnbound_phos*1.6

	#CheY phosphorylation by T and dephosphorylation by CheZ
	YP: T(Phos~P) + CheY(Phos~U) -> T(Phos~U) + CheY(Phos~P) k_Y_phos
	YDep: CheZ() + CheY(Phos~P) -> CheZ() + CheY(Phos~U) k_Y_dephos

	#CheR binds to and methylates receptor complex
	#Rate dependent on methylation states and ligand binding
	TRBind: T(r) + CheR(t) <-> T(r!2).CheR(t!2) k_TR_bind, k_TR_dis
	TaRUnboundMeth: T(r!2,l,Meth~A).CheR(t!2) -> T(r,l,Meth~B) + CheR(t) k_TaR_meth
	TbRUnboundMeth: T(r!2,l,Meth~B).CheR(t!2) -> T(r,l,Meth~C) + CheR(t) k_TaR_meth*0.1
	TaRLigandMeth: T(r!2,l!1,Meth~A).L(t!1).CheR(t!2) -> T(r,l!1,Meth~B).L(t!1) + CheR(t) k_TaR_meth*30
	TbRLigandMeth: T(r!2,l!1,Meth~B).L(t!1).CheR(t!2) -> T(r,l!1,Meth~C).L(t!1) + CheR(t) k_TaR_meth*3

	#CheB is phosphorylated by receptor complex, and autodephosphorylates
	CheBphos: T(Phos~P) + CheB(Phos~U) -> T(Phos~U) + CheB(Phos~P) k_B_phos
	CheBdephos: CheB(Phos~P) -> CheB(Phos~U) k_B_dephos

	#CheB demethylates receptor complex
	#Rate dependent on methyaltion states
	TbDemeth: T(Meth~B) + CheB(Phos~P) -> T(Meth~A) + CheB(Phos~P) k_Tb_demeth
	TcDemeth: T(Meth~C) + CheB(Phos~P) -> T(Meth~B) + CheB(Phos~P) k_Tc_demeth

end reaction rules
Adding Compartments
In biological systems, the plasma membrane separates molecules inside of the cell from the external environment. In our chemotaxis system, ligands are outside of the cell, receptors and flagellar proteins are on the membrane, and CheY, CheR, CheB, CheZ are inside the cell.
BioNetGen allows us to compartmentalize our model based on the location of different molecules. Although our model does not call for compartmentalization, it has value in models where we need different concentrations based on different cellular compartments, influencing the rates of reactions involving molecules within these compartments. For this reason, we will take the opportunity to add compartmentalization into our model.
Below, we define three compartments corresponding to extra-cellular space (outside the cell), the plasma membrane, and the cytoplasm (inside the cell). Each row indicates four parameters:
- the name of the compartment;
- the dimension (2-D or 3-D);
- surface area (2-D) or volume (3-D) of the compartment; and
- the name of the parent compartment - the compartment that encloses this current compartment.
If you are interested, more information on compartmentalization can be found on pages 54-55 of Sekar and Faeder’s primer on rule-based modeling: http://www.lehman.edu/academics/cmacs/documents/RuleBasedPrimer-2011.pdf.
begin compartments
	EC  3  100       #um^3
	PM  2  1   EC    #um^2
	CP  3  1   PM    #um^3
end compartments
Specifying concentrations and reaction rates
To add compartmentalization information in the species section of our BioNetGen model, we use the notation @location before the specification of the concentrations. In what follows, we specify initial concentrations of ligand, receptor, and chemotaxis enzymes at different states. The distribution of molecule concentrations at each state is very difficult to verify experimentally; the distribution provided here approximates equilibrium concentrations in our simulation, and they are within a biologically reasonable range.2
begin species
	@EC:L(t) L0
	@PM:T(l,r,Meth~A,Phos~U) T0*0.84*0.9
	@PM:T(l,r,Meth~B,Phos~U) T0*0.15*0.9
	@PM:T(l,r,Meth~C,Phos~U) T0*0.01*0.9
	@PM:T(l,r,Meth~A,Phos~P) T0*0.84*0.1
	@PM:T(l,r,Meth~B,Phos~P) T0*0.15*0.1
	@PM:T(l,r,Meth~C,Phos~P) T0*0.01*0.1
	@CP:CheY(Phos~U) CheY0*0.71
	@CP:CheY(Phos~P) CheY0*0.29
	@CP:CheZ() CheZ0
	@CP:CheB(Phos~U) CheB0*0.62
	@CP:CheB(Phos~P) CheB0*0.38
	@CP:CheR(t) CheR0
end species
Finally, we need to assign values to the parameters. We will assume that we start with a zero ligand concentration. We then assign the initial concentration of each molecule and rates of our reactions based on in vivo stoichiometry and parameter tuning 34.
Note: Although we discussed reaction rules first, the parameters section below has to appear before the reaction rules section.
begin parameters
	NaV 6.02e8   #Unit conversion to cellular concentration M/L -> #/um^3
	miu 1e-6

	L0 0             #number of molecules/cell
	T0 7000          #number of molecules/cell
	CheY0 20000      #number of molecules/cell
	CheZ0 6000       #number of molecules/cell
	CheR0 120        #number of molecules/cell
	CheB0 250        #number of molecules/cell

	k_lr_bind 8.8e6/NaV    #ligand-receptor binding
	k_lr_dis 35            #ligand-receptor dissociation

	k_TaUnbound_phos 7.5   #receptor complex autophosphorylation

	k_Y_phos 3.8e6/NaV     #receptor complex phosphorylates Y
	k_Y_dephos 8.6e5/NaV   #Z dephosphorylates Y

	k_TR_bind  2e7/NaV     #Receptor-CheR binding
	k_TR_dis   1           #Receptor-CheR dissociation
	k_TaR_meth 0.08        #CheR methylates receptor complex

	k_B_phos 1e5/NaV       #CheB phosphorylation by receptor complex
	k_B_dephos 0.17        #CheB autodephosphorylation

	k_Tb_demeth 5e4/NaV    #CheB demethylates receptor complex
	k_Tc_demeth 2e4/NaV    #CheB demethylates receptor complex
end parameters
Completing our adaptation simulation
We will be ready to simulate once we place the following code after end model. We will run our simulation for 800 seconds.
generate_network({overwrite=>1})
simulate({method=>"ssa", t_end=>800, n_steps=>800})
The following code contains our complete simulation.
begin model

begin molecule types
	L(t)
	T(l,r,Meth~A~B~C,Phos~U~P)
	CheY(Phos~U~P)
	CheZ()
	CheB(Phos~U~P)
	CheR(t)
end molecule types

begin observables
	Molecules bound_ligand L(t!1).T(l!1)
	Molecules phosphorylated_CheY CheY(Phos~P)
	Molecules low_methyl_receptor T(Meth~A)
	Molecules medium_methyl_receptor T(Meth~B)
	Molecules high_methyl_receptor T(Meth~C)
	Molecules phosphorylated_CheB CheB(Phos~P)
	Molecules CheRbound T(r!2).CheR(t!2)
end observables

begin parameters
	NaV2 6.02e8   #Unit conversion to cellular concentration M/L -> #/um^3
	miu 1e-6

	L0 0
	T0 7000
	CheY0 20000
	CheZ0 6000
	CheR0 120
	CheB0 250

	k_lr_bind 8.8e6/NaV2   #ligand-receptor binding
	k_lr_dis 35            #ligand-receptor dissociation

	k_TaUnbound_phos 7.5   #receptor complex autophosphorylation

	k_Y_phos 3.8e6/NaV2    #receptor complex phosphorylates Y
	k_Y_dephos 8.6e5/NaV2  #Z dephosphorylates Y

	k_TR_bind 2e7/NaV2          #Receptor-CheR binding
	k_TR_dis  1            #Receptor-CheR dissociaton
	k_TaR_meth 0.08        #CheR methylates receptor complex

	k_B_phos 1e5/NaV2      #CheB phosphorylation by receptor complex
	k_B_dephos 0.17        #CheB autodephosphorylation

	k_Tb_demeth 5e4/NaV2   #CheB demethylates receptor complex
	k_Tc_demeth 2e4/NaV2   #CheB demethylates receptor complex
end parameters

begin reaction rules
	LR: L(t) + T(l) <-> L(t!1).T(l!1) k_lr_bind, k_lr_dis

	#Receptor complex (specifically CheA) autophosphorylation
	#Rate dependent on methylation and binding states
	#Also on free vs. bound with ligand
	TaUnboundP: T(l,Meth~A,Phos~U) -> T(l,Meth~A,Phos~P) k_TaUnbound_phos
	TbUnboundP: T(l,Meth~B,Phos~U) -> T(l,Meth~B,Phos~P) k_TaUnbound_phos*1.1
	TcUnboundP: T(l,Meth~C,Phos~U) -> T(l,Meth~C,Phos~P) k_TaUnbound_phos*2.8
	TaLigandP: L(t!1).T(l!1,Meth~A,Phos~U) -> L(t!1).T(l!1,Meth~A,Phos~P) 0
	TbLigandP: L(t!1).T(l!1,Meth~B,Phos~U) -> L(t!1).T(l!1,Meth~B,Phos~P) k_TaUnbound_phos*0.8
	TcLigandP: L(t!1).T(l!1,Meth~C,Phos~U) -> L(t!1).T(l!1,Meth~C,Phos~P) k_TaUnbound_phos*1.6

	#CheY phosphorylation by T and dephosphorylation by CheZ
	YP: T(Phos~P) + CheY(Phos~U) -> T(Phos~U) + CheY(Phos~P) k_Y_phos
	YDep: CheZ() + CheY(Phos~P) -> CheZ() + CheY(Phos~U) k_Y_dephos

	#CheR binds to and methylates receptor complex
	#Rate dependent on methylation states and ligand binding
	TRBind: T(r) + CheR(t) <-> T(r!2).CheR(t!2) k_TR_bind, k_TR_dis
	TaRUnboundMeth: T(r!2,l,Meth~A).CheR(t!2) -> T(r,l,Meth~B) + CheR(t) k_TaR_meth
	TbRUnboundMeth: T(r!2,l,Meth~B).CheR(t!2) -> T(r,l,Meth~C) + CheR(t) k_TaR_meth*0.1
	TaRLigandMeth: T(r!2,l!1,Meth~A).L(t!1).CheR(t!2) -> T(r,l!1,Meth~B).L(t!1) + CheR(t) k_TaR_meth*30
	TbRLigandMeth: T(r!2,l!1,Meth~B).L(t!1).CheR(t!2) -> T(r,l!1,Meth~C).L(t!1) + CheR(t) k_TaR_meth*3

	#CheB is phosphorylated by receptor complex, and autodephosphorylates
	CheBphos: T(Phos~P) + CheB(Phos~U) -> T(Phos~U) + CheB(Phos~P) k_B_phos
	CheBdephos: CheB(Phos~P) -> CheB(Phos~U) k_B_dephos

	#CheB demethylates receptor complex
	#Rate dependent on methyaltion states
	TbDemeth: T(Meth~B) + CheB(Phos~P) -> T(Meth~A) + CheB(Phos~P) k_Tb_demeth
	TcDemeth: T(Meth~C) + CheB(Phos~P) -> T(Meth~B) + CheB(Phos~P) k_Tc_demeth

end reaction rules

begin compartments
  EC  3  100       #um^3
  PM  2  1   EC    #um^2
  CP  3  1   PM    #um^3
end compartments

begin species
	@EC:L(t) L0
	@PM:T(l,r,Meth~A,Phos~U) T0*0.84*0.9
	@PM:T(l,r,Meth~B,Phos~U) T0*0.15*0.9
	@PM:T(l,r,Meth~C,Phos~U) T0*0.01*0.9
	@PM:T(l,r,Meth~A,Phos~P) T0*0.84*0.1
	@PM:T(l,r,Meth~B,Phos~P) T0*0.15*0.1
	@PM:T(l,r,Meth~C,Phos~P) T0*0.01*0.1
	@CP:CheY(Phos~U) CheY0*0.71
	@CP:CheY(Phos~P) CheY0*0.29
	@CP:CheZ() CheZ0
	@CP:CheB(Phos~U) CheB0*0.62
	@CP:CheB(Phos~P) CheB0*0.38
	@CP:CheR(t) CheR0
end species

end model

generate_network({overwrite=>1})
simulate({method=>"ssa", t_end=>800, n_steps=>800})
Running our adaptation model
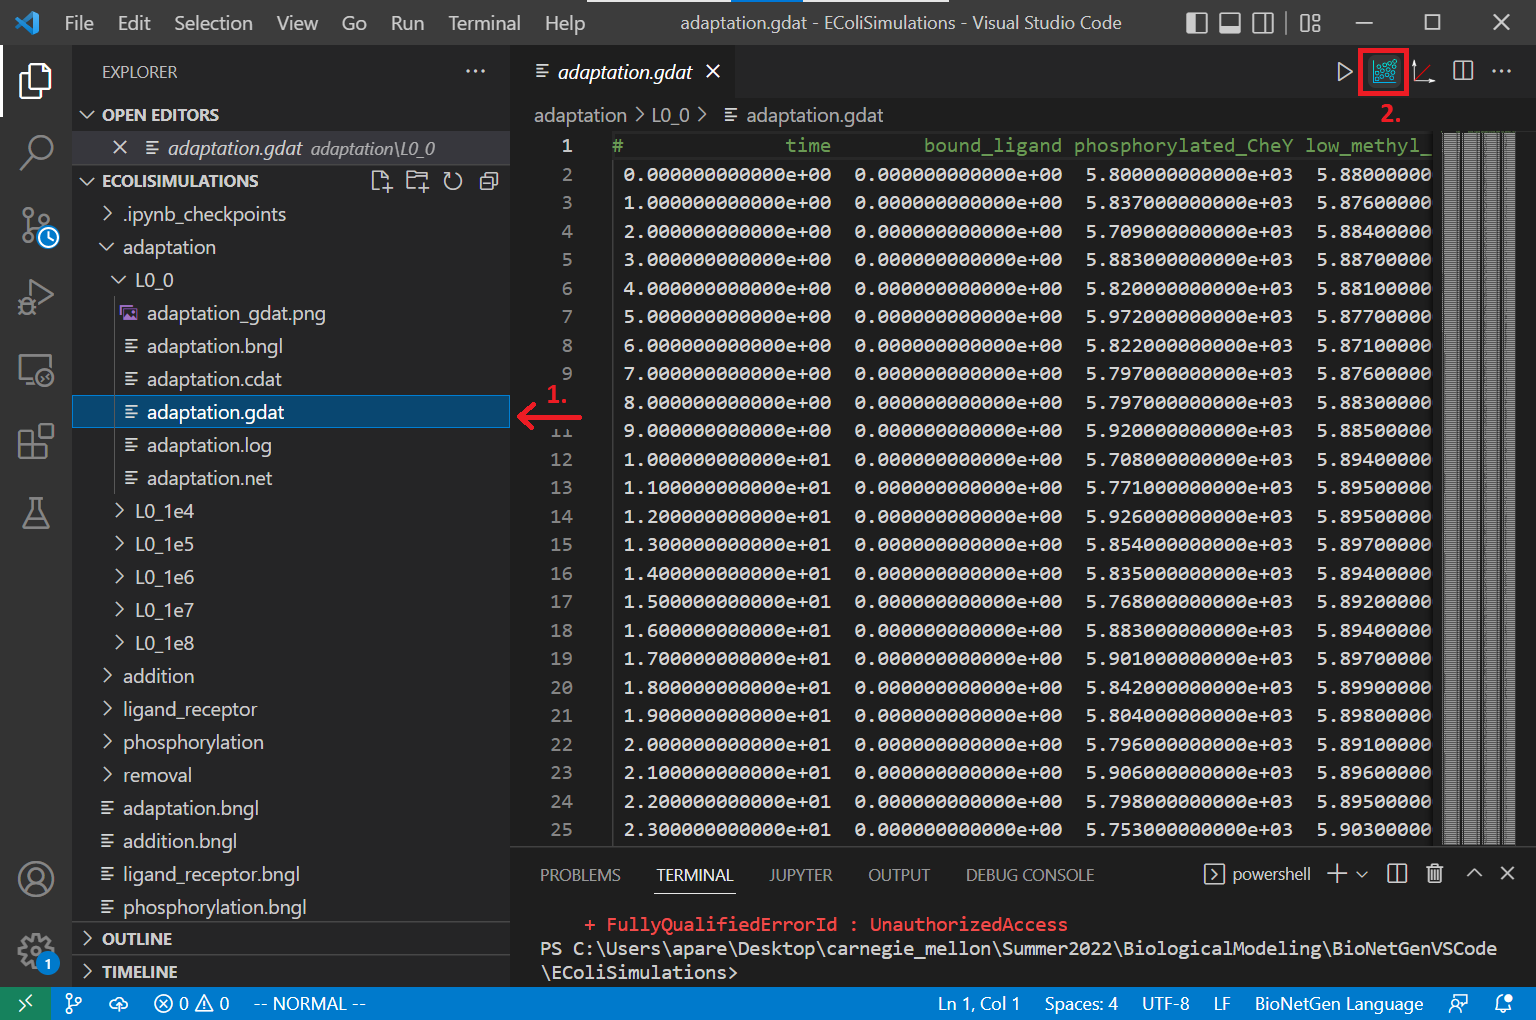
Now save your file and run the simulation by clicking on the Run BNG button. The results will be saved in a new folder called adaptation/TIMESTAMP contained in the current directory. Rename the newly created folder from the time stamp to L0_0.

Next, open the newly created adaptation.gdat file in your results folder and create a plot by clicking the Built-in plotting button.
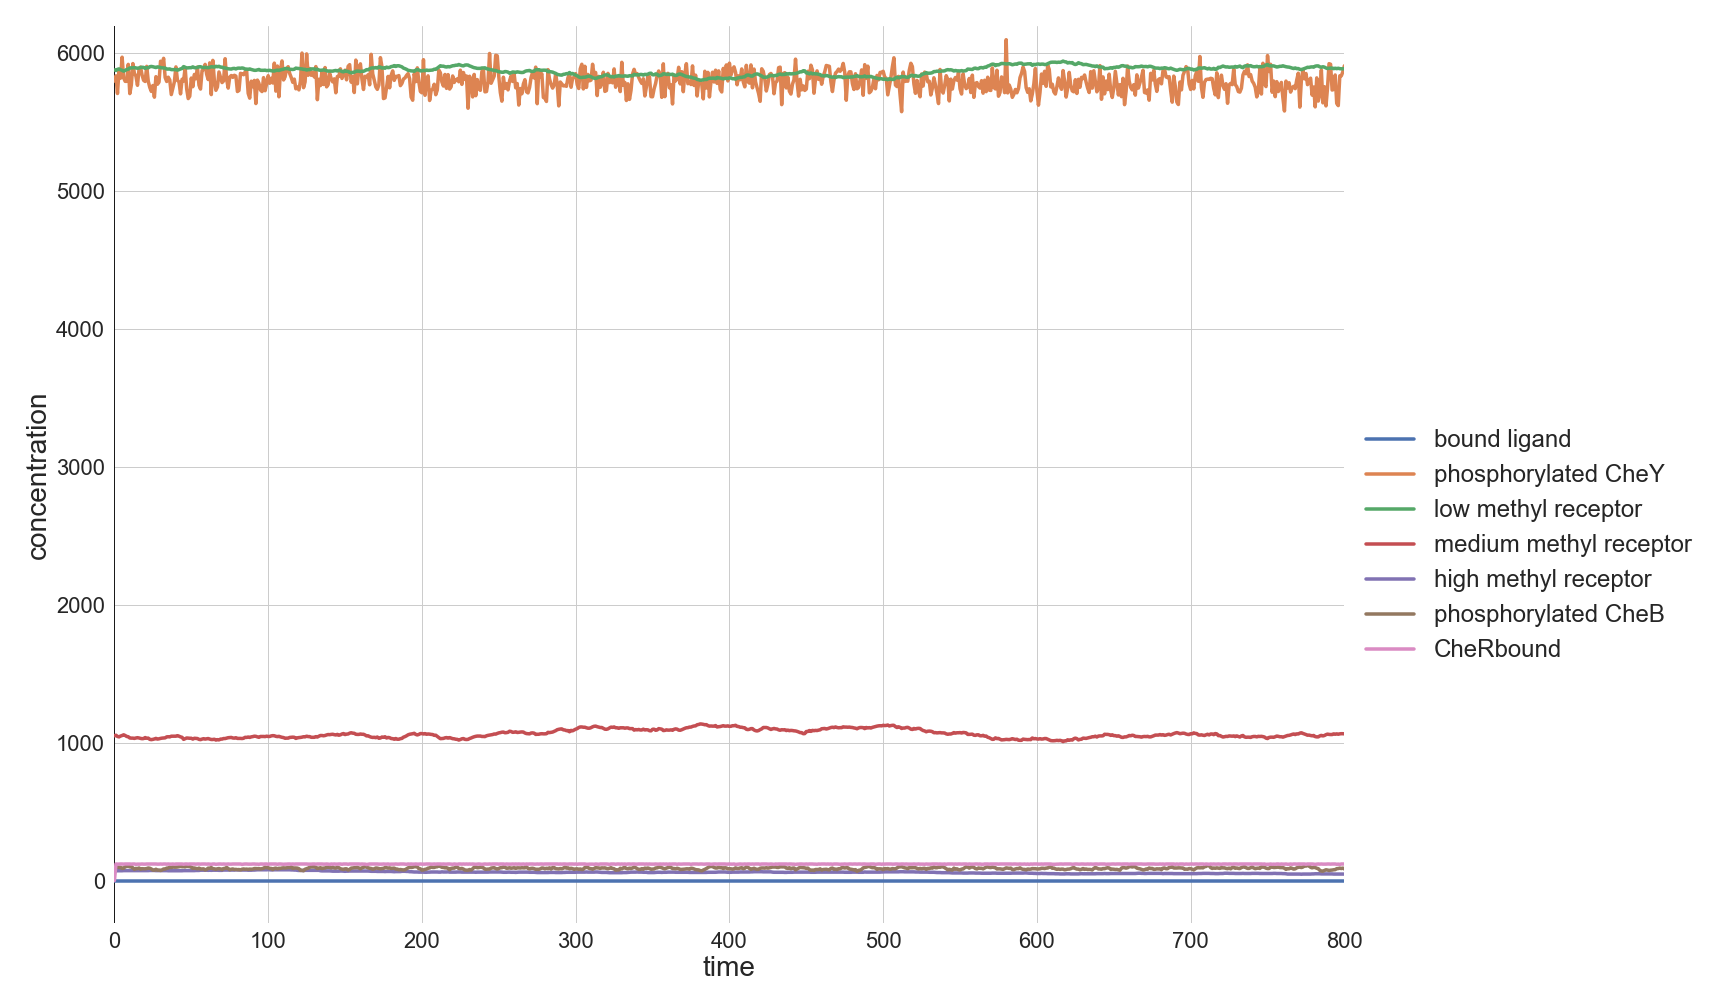
Because the model is at equilibrium, we will see the seemingly boring plot shown below.
Things get interesting when we change the initial concentration of ligand to see how the simulated bacterium will adapt. Run your simulation with L0 = 1e6. What happens to CheY activity? What happens to the concentration of receptors at different methylation states?
Try a variety of different initial concentrations of ligand (L0 = 1e4, 1e5, 1e6, 1e7, 1e8), paying attention to the concentration of phosphorylated CheY. How does the concentration change depending on initial ligand concentration?
Then try to further raise the ligand concentration to 1e9 and 1e10. How does this affect the outcome of the simulation? Why?
Next, try only simulating the first 10 seconds to zoom into what happens to the system at the start. How quickly does CheY concentration reach a minimum? How long does the cell take to return to the original concentration of phosphorylated CheY (i.e., the background tumbling frequency)?
Back in the main text, we will examine how a sudden change in the concentration of unbound ligand can cause a quick change in the tumbling frequency of the bacterium, followed by a slow return to its original frequency. We will also see how the extent to which this tumbling frequency is disturbed is dependent upon differences in the initial concentration of ligand.
-
Spiro PA, Parkinson JS, and Othmer H. 1997. A model of excitation and adaptation in bacterial chemotaxis. Biochemistry 94:7263-7268. Available online. ↩
-
Bray D, Bourret RB, Simon MI. 1993. Computer simulation of phosphorylation cascade controlling bacterial chemotaxis. Molecular Biology of the Cell. Available online ↩
-
Li M, Hazelbauer GL. 2004. Cellular stoichiometry of the components of the chemotaxis signaling complex. Journal of Bacteriology. Available online ↩
-
Stock J, Lukat GS. 1991. Intracellular signal transduction networks. Annual Review of Biophysics and Biophysical Chemistry. Available online ↩
