 Leanpub
Image segmentation requires a tailored approach
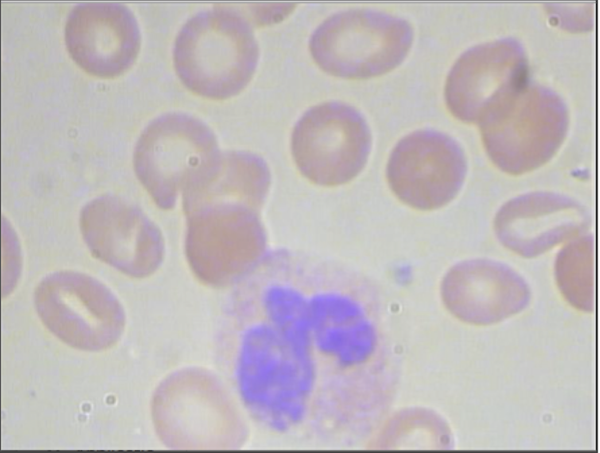
We begin our work by discussing how to segment WBC nuclei from blood cell images like the one below, reproduced from the introduction.
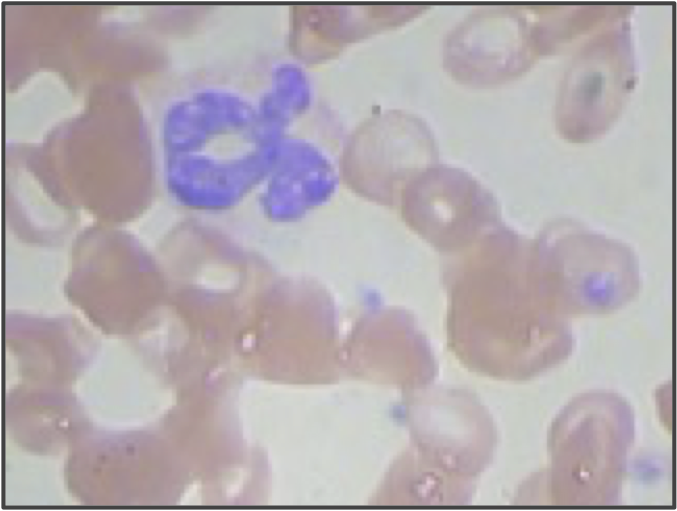 The granulocyte presented in the introduction (having ID 3 in our dataset).
Researchers have developed many algorithms for cellular image segmentation, but no single approach can be used in all contexts. We therefore will identify the key attributes that make this dataset special, which we will use to develop our own segmentation algorithm.
What makes the WBC nucleus so easy for a human to spot in the above blood cell? You may be screaming, “It is dark blue! How hard could it be?” But to train a computer to segment images by color, we should first understand how the computer encodes color in images.
Using the RGB color model for segmentation
In the RGB color model, every rectangular pixel on a computer screen emits a single color formed as a mixture of differing amounts of the three primary colors of light: red, green, and blue (hence the acronym “RGB”). The intensity of each primary color in a pixel is expressed as an integer between 0 and 255, inclusively, with larger integers corresponding to greater intensities.
A few colors are shown in the figure below along with their RGB equivalents; for example, magenta corresponds to equal parts red and blue. Note that a color like (128, 0, 0) contains only red but appears duskier than (256, 0, 0) because the red in that pixel is less intense.
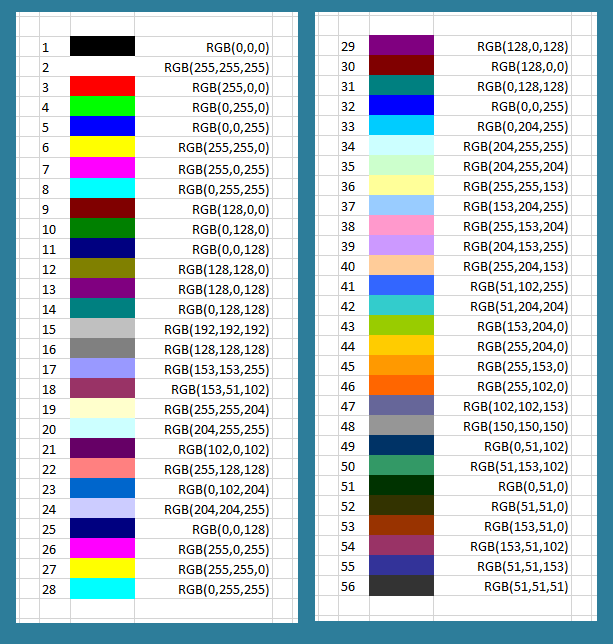
A collection of colors along with their RGB codes. This table corresponds to mixing colors of light instead of pigment, which causes some non-intuitive effects; for example, yellow is formed by mixing equal parts red and green. The last six colors appear muted because they only receive half of a given color value compared to a color that receives 256 units. If all three colors are mixed in equal proportions, then we obtain a color on the gray scale between white (255, 255, 255) and black (0, 0, 0). Source: Excel at Finance.
The RGB model gives us an idea for segmenting a WBC nucleus. If we scan through the pixels in a blood cell image, we can ignore any pixels whose RGB color values are not sufficiently blue; hopefully, the remaining pixels are found in the WBC nucleus.
STOP: You can find a color picker in Utilities > Digital Color Meter (Mac OS X) or by using ShareX (Windows). Open your color picker, and hover the picker over different parts of the granulocyte image above. What are the typical RGB values for the WBC nucleus, and how do these RGB values differ from those of the RBCs and the image background?
Binarizing images via single-channel color thresholds
We will binarize each blood cell image by coloring a pixel white if its blue value is above some threshold, and coloring a pixel black if its blue value is beneath some threshold.
The binarized version of the above granulocyte image using the threshold value of 153 is shown in the figure below. Unfortunately, we cannot clearly see the WBC nucleus in this binarized image because although the nucleus’s pixels have high blue values, so do those of the image’s background, which have high intensities of red, green, and blue, producing the background’s light appearance.
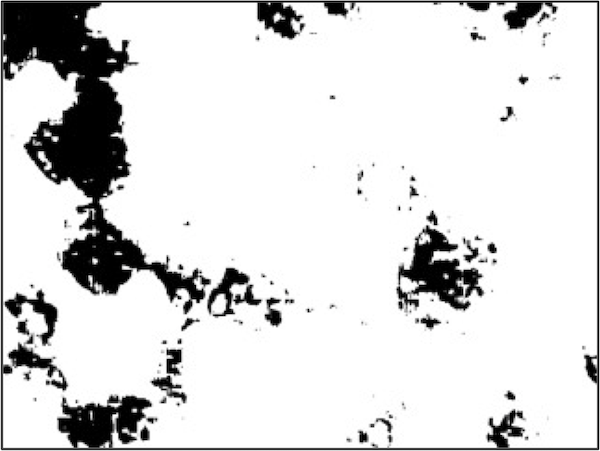
A binarized version of the granulocyte image from the previous figure (having image ID 3 in our dataset). A pixel is colored white if it has a blue value of 153 or greater, and a pixel is colored black otherwise. The region with the nucleus is not clearly visible because much of the original image’s background is light, and so its pixels have large red, green, and blue values.
STOP: How might we modify our segmentation approach to perform a binarization that identifies the WBC nucleus more effectively?
We were unable to distinguish between the image background and the WBC nucleus using blue color values, but pixels in the WBC nucleus tend to have a green value that is much lower than the image background and a red value that is lower than every other part of the image. The figure below shows two binarizations of the original image using a green threshold of 153 (left) and a red threshold of 166 (Right).

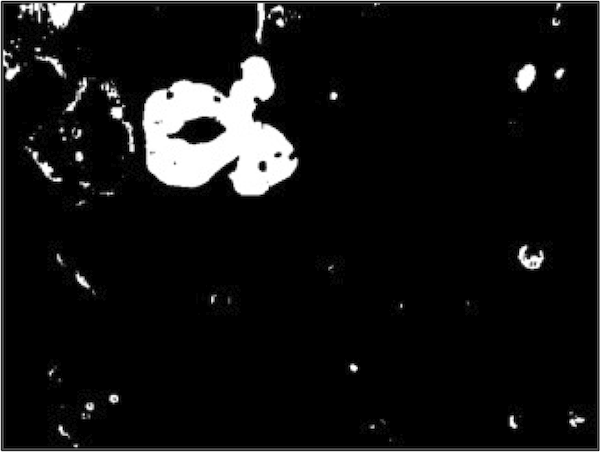
It might seem that we should work with the binarized image based on the red threshold, which contains the clearest image of the nucleus among the three binarized images. However, note that each threshold was successful in eliminating some of the non-nuclear parts of the image. For example, the white regions in the top left of both binarized images in the figure above was eliminated by the binarized image based on the blue threshold, which initially did not seem helpful.
This insight gives us an idea: if each of the three binarized images based on thresholding a single color channel was successful at excluding some part of the image, then let us produce a fourth image in which a pixel is colored white only if it is white in all three binarized images, and a pixel is colored black if it is black in any of the three binarized images. In the following tutorial, we will build an R pipeline that implements this approach to produce binarized WBC nuclei for all our blood cell images.
Successful segmentation is subject to parameters
If you followed the above tutorial, then you may be tempted to celebrate, since it seems that we have resolved our first main objective of identifying WBCs. Indeed, if we segment all of the images in the dataset via the same process, then we typically obtain a nice result, as indicated in the figure below for the sample monocyte and lymphocyte images presented in the introduction.


At the same time, no segmentation pipeline is perfect. The figure below illustrates that for a few images in our dataset, we may not correctly segment the entire nucleus.

We can continue to tweak threshold parameters, but our relatively simple algorithm successfully segments almost every WBC nucleus from our dataset, and we are ready to move on to classify WBC nuclei into families.
