 Leanpub
The classification problem and the iris flower dataset
Categorizing images of WBCs according to family is a specific instance of a ubiquitous problem in data science, in which we wish to classify each object in a given dataset into one of k groups called classes. In our ongoing example, the data are images of WBC nuclei, and the classes are the three main families of WBCs (granulocytes, lymphocytes, and monocytes). To take a different example, our data could be tumor genomes sequenced from cancer patients, which we want to classify according to the therapeutic that should be prescribed for the patient. Or the data may be the past sales behavior of shoppers, whom we wish to classify into two classes based on a prediction of whether they will buy a new product.
A classical dataset commonly used for motivating classification is the iris flower dataset, which was compiled by Edgar Anderson12 and used by Ronald Fisher in a seminal paper on classification in 19363. Anderson took morphological measurements from 150 iris flowers, evenly divided over three species (see figure below).

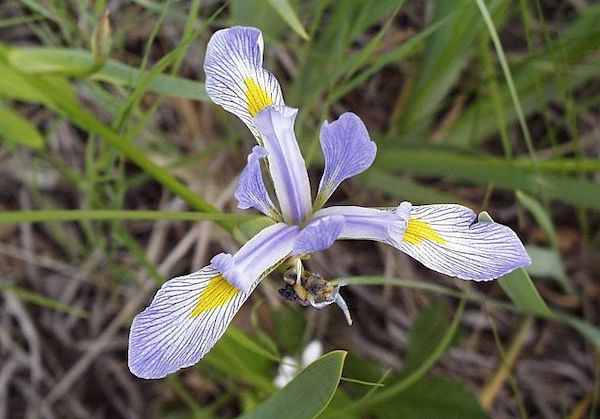

Anderson measured four attributes, or features, of each flower in his dataset: the width and height of the flower’s petal, and the width and height of the flower’s sepal (a green offshoot beneath the petals). The features and species labels for twelve flowers in the iris flower dataset are shown in the table below (click here for the full dataset). Fisher noticed that flowers from the same species had similar features and wondered whether it was possible to classify the flowers according to its species using only Anderson’s four features.
| Sepal length (cm) | Sepal width (cm) | Petal length (cm) | Petal width (cm) | Species |
|---|---|---|---|---|
| 5.1 | 3.5 | 1.4 | 0.2 | I. setosa |
| 4.9 | 3.0 | 1.4 | 0.2 | I. setosa |
| 4.7 | 3.2 | 1.3 | 0.2 | I. setosa |
| 4.6 | 3.1 | 1.5 | 0.2 | I. setosa |
| 7.0 | 3.2 | 4.7 | 1.4 | I. versicolor |
| 6.4 | 3.2 | 4.5 | 1.5 | I. versicolor |
| 6.9 | 3.1 | 4.9 | 1.5 | I. versicolor |
| 5.5 | 2.3 | 4.0 | 1.3 | I. versicolor |
| 6.3 | 3.3 | 6.0 | 2.5 | I. virginica |
| 5.8 | 2.7 | 5.1 | 1.9 | I. virginica |
| 7.1 | 3.0 | 5.9 | 2.1 | I. virginica |
| 6.3 | 2.9 | 5.6 | 1.8 | I. virginica |
A table containing values of the four features for twelve members of the iris flower dataset. The complete dataset was accessed from the University of California, Irvine Machine Learning Repository].
STOP: What are typical feature values for flowers from each species in the table above? If presented with an iris of unknown species, how could you use these features to classify it?
From flower measurements to feature vectors
If we were to use only two of the four features in the iris flower dataset, then a flower’s feature values x and y could be represented as a point in two-dimensional space (x, y). The figure below shows such a plot for the features of petal length (x-axis) and petal width (y-axis).
 Petal length (x-axis) plotted against width (y-axis) for each of the flowers in the iris flower dataset, with data points colored by species. Although there were fifty flowers from each species, there are not fifty points corresponding to every species because some flowers have the same petal length and width and therefore occupy the same point.
Note how stark the pattern in the above figure is. Even though we chose only two features from the iris flowers, the points associated with the flowers mostly divide into three main clusters by species.
If we were to use all four features for the iris dataset, then every flower would be represented by a point in four-dimensional space. For example, the first flower in our initial table of iris features would be represented by the point (5.1, 3.5, 1.4, 0.2). In general, when classifying a collection of data with n features, each element in the dataset can be represented by a feature vector of length n, whose i-th value corresponds to the value of the data point’s i-th feature.
Using k-Nearest Neighbors to classify unknown samples
Our hope is that for datasets other than the iris flower dataset, elements from the same class will have feature vectors that are nearby in n-dimensional space. If so, then we can classify a data point whose class is unknown by determining which data points with known classification it is near.
STOP: Consider the gray point with unknown class in the figure below. Should it be assigned to the class of the green points or to the class of the blue points?
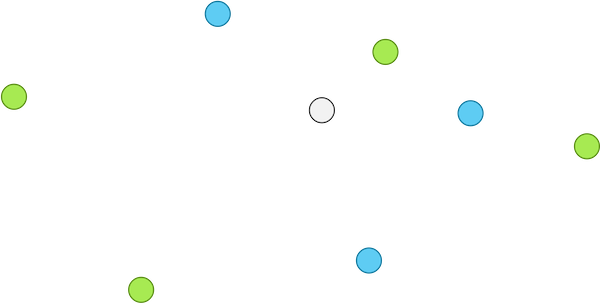 An unknown point (gray) along with a collection of nearby points belonging to two classes, colored green and blue.
The preceding question indicates that classifying points can be surprisingly open-ended. Because of this freedom, researchers have devised a variety of different approaches for classifying data given data with known classes.
We will discuss a simple but powerful classification algorithm called k-nearest neighbors, or k-NN4. In k-NN, we fix a positive integer k in advance. Then, for each point with unknown class, we assign it to the class possessed by the largest number of its k closest neighbors.
In the ongoing example, if we were using k equal to 1, then we would assign the unknown point to the green class (see figure below).
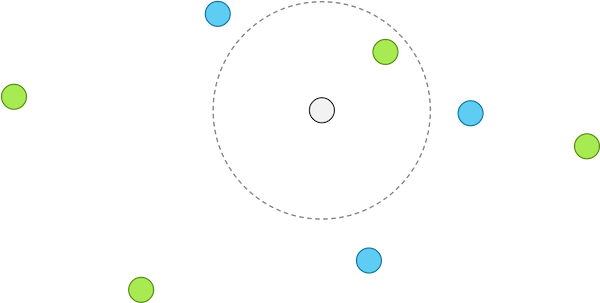 When k is equal to 1, k-NN classifies an unknown point according to the point of known class that is nearest; for this reason, the gray point above with unknown class would be assigned to the green class.
However, with the same data and k equal to 4, the figure below shows that a majority of the k nearest neighbors are blue, and so we classify the unknown point as blue. This example reinforces a theme of this course, that the results of an algorithm can be sensitive to our choice of parameters.
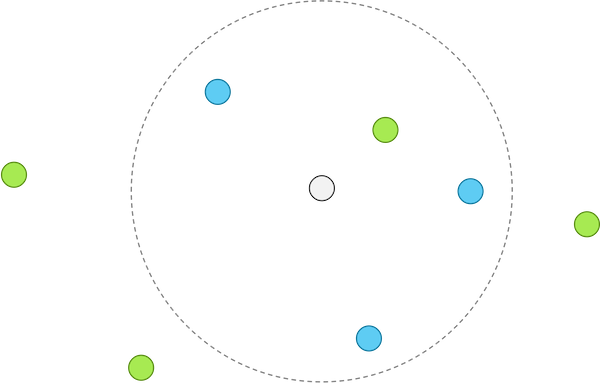 When using k-NN with k equal to 4, k-NN classifies the unknown point as blue, since three of its four closest neighbors are blue.
STOP: When k is equal to 2 or 6 for the ongoing example, we obtain a tie in the number of points from each known class belonging to the k nearest neighbors of a point with unknown class. How could we break ties in k-NN?
In the more general case in which feature vectors have n coordinates, we can determine which points are nearest to a given point by using the Euclidean distance, which generalizes the distance formula between vectors in three-dimensional space to the case of n-dimensional vectors. The Euclidean distance between vectors x = (x1, x2, …, xn) and y = (y1, y2, …, yn) is given by the sum of squares of differences between corresponding vector elements:
\[d(\mathbf{x}, \mathbf{y}) = \sqrt{(x_1 - y_1)^2 + (x_2 - y_2)^2 + \cdots + (x_n-y_n)^2}\,.\]We now have learned how to use k-NN to classify feature vectors with unknown classes given vectors with known classes. There is just one problem: how can we convert an image of a WBC nucleus into a vector?
-
Anderson E (1935) The irises of the Gaspe Peninsula. Bulletin of the American Iris Society 59: 2-5. ↩
-
Anderson E (1936) The species problem in Iris. Annals of the Missouri Botanical Garden 23(3):457-509. Available online ↩
-
Fisher RA (1936) The Use of Multiple Measurements in Taxonomic Problems. Annals of Eugenics 7(2):179-188. Available online ↩
-
Fix E. and Hodges J.L. (1951) Discriminatory Analysis, Nonparametric Discrimination: Consistency Properties. Technical Report 4, USAF School of Aviation Medicine, Randolph Field. Available online ↩
