Neural networks and logical connectives
One of the strengths of neural networks is that their output can mimic, at least approximately, any function. In the case of classification, this means that if some function g(x1, …, xn) performs well at classifying data with n features, then some neural network exists that will replicate g: we just need to find the right set of network parameters.
We say that a neural network with input variables x1, …, xn represents a function g(x1, …, xn) if for any choice of input variables x1, …, xn, the output of the neural network is equal to g(x1, …, xn). We provide two exercises on finding neural networks that represent relatively simple functions.
Exercise: Consider the function g(x1, x2) for binary input variables x1 and x2 that outputs 0 when x1 and x2 are both equal to 1 and that outputs 1 for other choices of x1 and x2. (The function g is known as a “NAND gate”). Find a single perceptron that represents g.
Exercise: Consider the function g(x1, x2) for binary input variables x1 and x2 that outputs 1 when x1 ≠ x2 and 0 when x1 = x2. (The function g is known as an “XOR gate”). It can be shown that no single perceptron represents g; find a neural network of perceptrons that represents g.
A little fun with lost cities
Exercise: Consider the three points x = (−8, 1), y = (7, 6), and z = (10, −2). Say that the distances from these points to some point w with unknown location are as follows: d(x,w) = 13; d(y,w) = 3; d(z,w) = 10. Where is w?
Illustrating the curse of dimensionality with two iris samples
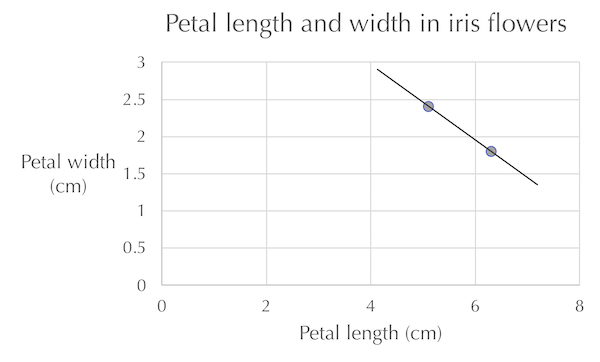
Intuitively, we would like to have a large number of features in our data (i.e., a large dimension of n in each data point’s feature vector). Yet consider the figure below, which plots the petal width and length of only two iris flowers. It would be a horrible idea to extrapolate anything from the line connecting these two points, as it indicates that these two variables are inversely coordinated, which is the opposite of the true correlation that we found in the main text.
 Petal length (x-axis) plotted against petal width (y-axis) for two flowers in the iris flower dataset. Because of random chance and small sample size, these two flowers demonstrate an inverse correlation between petal length and width, the opposite of the true correlation found in the main text.
This example provides another reason why we reduce the dimension of a dataset when the number of objects in our dataset is smaller than the number of features of each object. Furthermore, when fitting a d-dimensional hyperplane to a collection of data, we need to be careful with selecting too large of a value of d, especially if we do not have many data points.
Exercise: What is the minimum number of points in three-dimensional space such that we cannot guarantee that there is some plane containing them all? Provide a conjecture as to the minimum number of points in n-dimensional space such that we cannot guarantee that there is some d-dimensional hyperplane containing them all.
PCA and feature selection on the iris dataset
Exercise: The iris flower dataset has four features. Apply PCA with d = 2 to reduce the dimension of this dataset. Then, apply k-NN with k equal to 1 and cross validation with f equal to 10 to the resulting vectors of reduced dimension to obtain a confusion matrix. What are the accuracy, recall, specificity, and precision? How do they compare against the results of using all four iris features that we found earlier?
Exercise: Another way to reduce the dimension of a dataset is to eliminate features from the dataset. Apply k-NN with k equal to 1 and cross validation with f equal to 10 to the iris flower dataset using only the two features petal width and petal length. Then, run the same classifier on your own choice of two iris features to obtain a confusion matrix. How do the results compare against the result of the previous exercise (which used PCA instead of feature elimination) and those from using all four features?
More classification of WBC images
Exercises coming soon!
